配置监控时,我们首要面对的是监控数据如果采集的问题。一般我们可以把监控指标分为两类:基础监控和业务监控。监控的目的无非是为了解服务运行状况、发现服务故障和帮助定位故障原因。
包括 CPU、内存、磁盘、端口和进程等机器、网络的操作系统级别的信息。通常情况下,成熟的监控系统(例如开源的 Prometheus、Zabbix 等)均会提供基础监控项的采集能力,这里不做过多介绍。但需要注意的一点,机器级别的基础监控指标一般并不能代表服务的真实运行状况,例如单台实例的故障对一个设计合理的分布式系统来说并不会带来严重后果。所以只有结合业务相关监控指标,基础监控指标才有意义。
业务监控指标由业务系统内部的服务产生,一般能够真实反应业务运行状态。设计合理的系统一般都会提供相关监控指标供监控系统采集。监控数据的采集方法一般可以分为以下几大类。
日志:日志可以包含服务运行的方方面面,是重要的监控数据来源。例如,通过 Nginx access 日志可以统计出错误(5xx)、延迟(响应时间)和流量,结合已知的容量上限就可以计算出饱和度。一般除监控系统提供的日志采集插件外,如 Rsyslog、Logstash、Filebeat、Flume 等都是比较优秀的日志采集软件。
JMX:多数 Java 开发的服务均可由 JMX 接口输出监控指标。不少监控系统也有集成 JMX 采集插件,除此之外我们也可通过 jmxtrans、jmxcmd 工具进行采集。
REST:提供 REST API 来进行监控数据的采集,如 Hadoop、ElasticSearch。
OpenMetrics:得益于 Prometheus 的流行,作为 Prometheus 的监控数据采集方案,OpenMetrics 可能很快会成为未来监控的业界标准。目前绝大部分热门开源服务均有官方或非官方的 exporter 可供使用。
命令行:一些服务提供本地的命令来输出监控指标。
主动上报:对于采用 PUSH 模型的监控系统来说,服务可以采取主动上报的方式把监控指标 push 到监控系统,如 Java 服务可使用 Metrics 接口自定义 sink 输出。另外,运维也可以使用自定义的监控插件来完成监控的采集。
1 2 3 4 5 6 7 8 brew install prometheus brew install grafana brew info prometheus
1 2 3 4 5 6 7 8 <dependency > <groupId > org.springframework.boot</groupId > <artifactId > spring-boot-starter-actuator</artifactId > </dependency > <dependency > <groupId > io.micrometer</groupId > <artifactId > micrometer-registry-prometheus</artifactId > </dependency >
1
2
3
4
5
6
7
8
9
10
11
12
13
14
15
16
17
18
management: endpoints: web: exposure: include: prometheus,health,info,metric metrics: export: prometheus: enabled: true tags: application: ${spring.application.name} endpoint: health: show-details: always info: app: name: ${spring.application.name}
1
2
3
4
5
6
7
8
9
10
11
12
13
14
15
16
17
18
19
20
21
22
23
24
25
26
27
28
29
30
31
32
33
34
35
36
37
38
39
@Slf4j @EnableDiscoveryClient @SpringBootApplication public class NlpKbProxyApplication private static final String line = "\n----------------------------------------------------------" ; public static void main (String[] args) throws UnknownHostException ConfigurableApplicationContext context = SpringApplication.run(NlpKbProxyApplication.class, args); String swaggerEnabled = context.getEnvironment().getProperty("swagger.enabled" ); afterRun(context, Boolean.parseBoolean(swaggerEnabled)); } private static void afterRun (ConfigurableApplicationContext applicationContext, boolean swaggerEnabled) throws UnknownHostException if (swaggerEnabled) { AbstractServletWebServerFactory webServerFactory = applicationContext.getBean(AbstractServletWebServerFactory.class); int port = webServerFactory.getPort(); String contextPath = webServerFactory.getContextPath(); log.info("\n访问swaggger接口调试 URLs:" + line + "\n" + "Local: \t\thttp://{}:{}{}/swagger-ui/index.html" + line , InetAddress.getLocalHost().getHostAddress(), port, contextPath); log.info("\n健康检查 URLs:" + line + "\n" + "Local: \t\thttp://{}:{}{}/actuator" + line , InetAddress.getLocalHost().getHostAddress(), port, contextPath); } } @Bean MeterRegistryCustomizer<MeterRegistry> configurer ( @Value("${spring.application.name}") String applicationName) return (registry) -> registry.config().commonTags("application" , applicationName); } }
访问 http://localhost:8080/actuator , 可以看到
1
2
3
4
5
6
7
8
9
10
11
12
13
14
15
16
17
18
19
20
21
22
23
24
{ "_links" : { "self" : { "href" : "http://localhost:8080/actuator" , "templated" : false }, "health-path" : { "href" : "http://localhost:8080/actuator/health/{*path}" , "templated" : true }, "health" : { "href" : "http://localhost:8080/actuator/health" , "templated" : false }, "info" : { "href" : "http://localhost:8080/actuator/info" , "templated" : false }, "prometheus" : { "href" : "http://localhost:8080/actuator/prometheus" , "templated" : false } } }
如果要监控系统基础指标, 此时并没有metrix, 需要在 prometheus.yml 中监听9100端口采集的metrix。
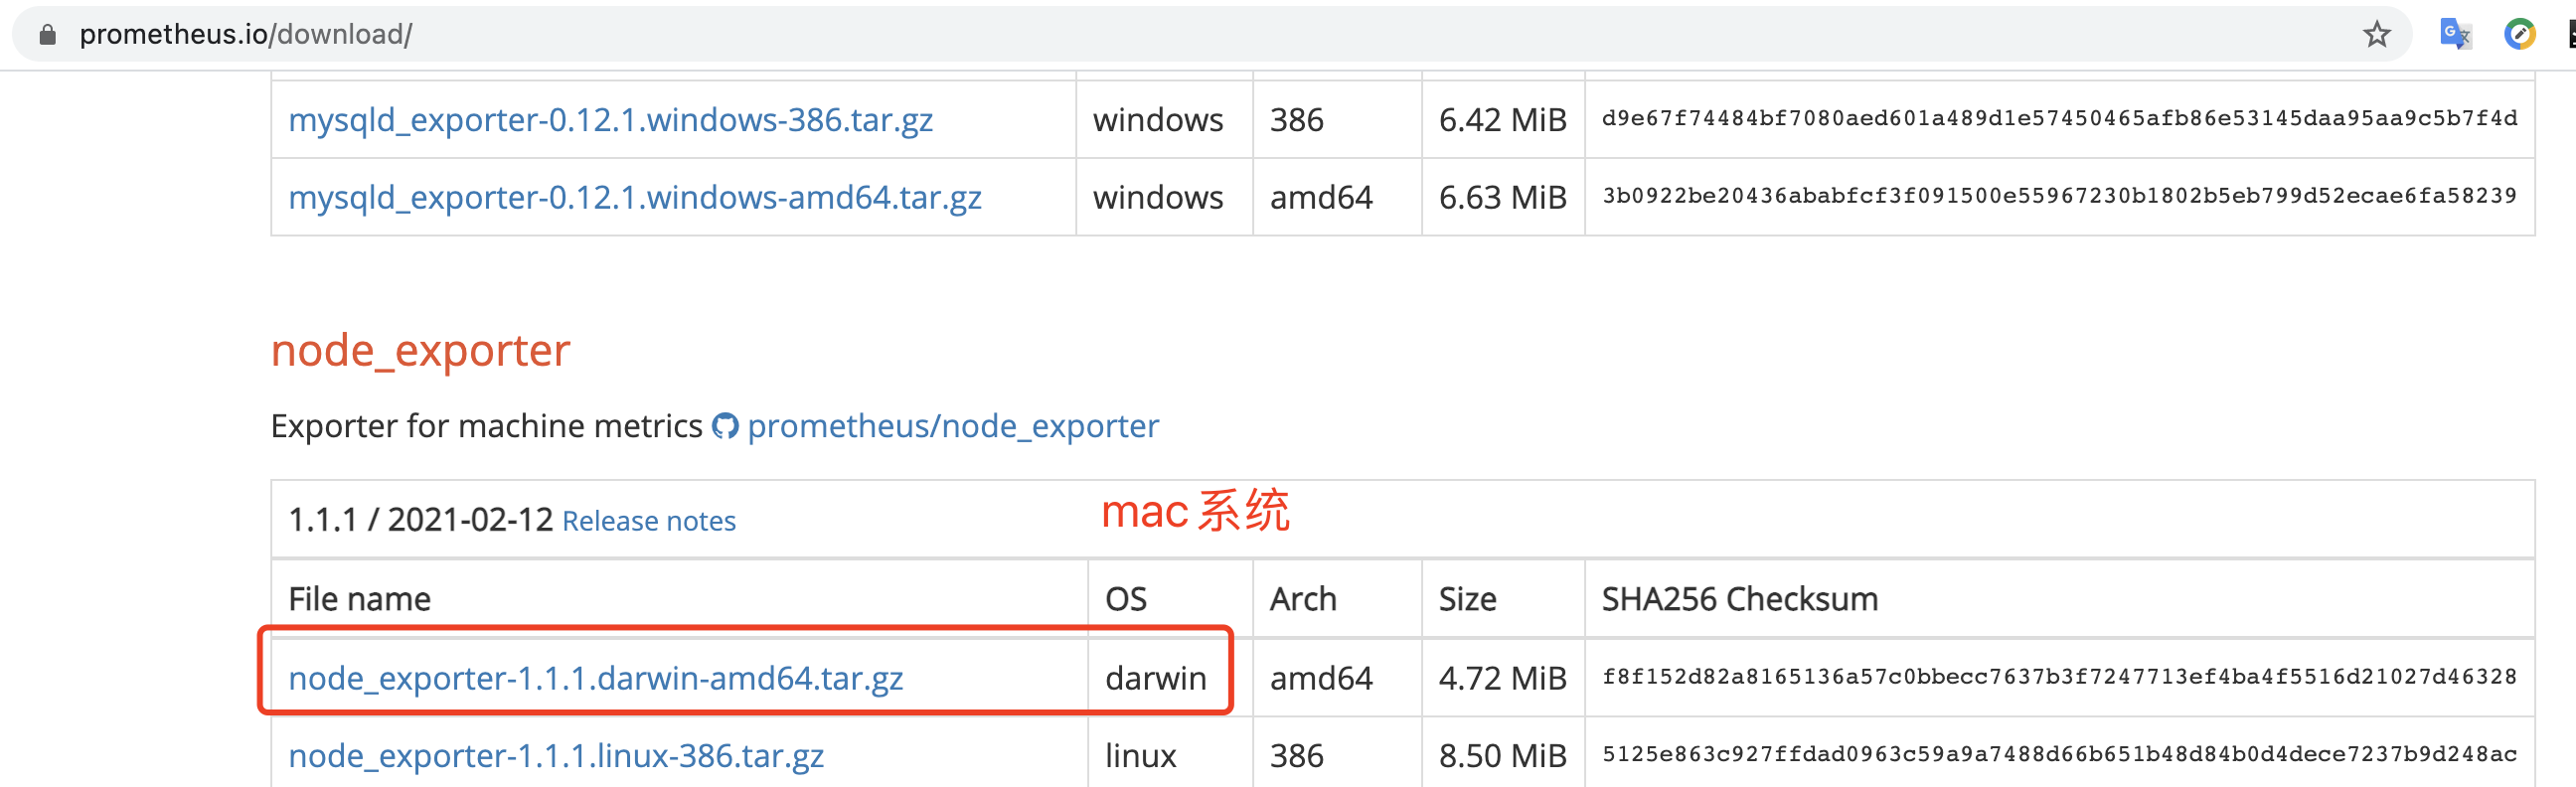
下载系统 node_exporter, 访问 https://prometheus.io/download/ , 如图
启动后访问 http://localhost:9100/ , 可以看到系统metrix。启动日志如下:
1
2
3
4
5
6
7
8
9
10
11
12
13
14
15
16
17
18
➜ node_exporter-1.1.1.darwin-amd64 ./node_exporter level=info ts=2021-02-26T16:35:39.925Z caller=node_exporter.go:178 msg="Starting node_exporter" version="(version=1.1.1, branch=HEAD, revision=4e837d4da79cc59ee3ed1471ba9a0d9547e95540)" level=info ts=2021-02-26T16:35:39.925Z caller=node_exporter.go:179 msg="Build context" build_context="(go=go1.15.8, user=root@f9e5f7d18c30, date=20210213-13:38:51)" level=info ts=2021-02-26T16:35:39.925Z caller=filesystem_common.go:74 collector=filesystem msg="Parsed flag --collector.filesystem.ignored-mount-points" flag=^/(dev)($|/) level=info ts=2021-02-26T16:35:39.925Z caller=filesystem_common.go:76 collector=filesystem msg="Parsed flag --collector.filesystem.ignored-fs-types" flag=^devfs$ level=info ts=2021-02-26T16:35:39.925Z caller=node_exporter.go:106 msg="Enabled collectors" level=info ts=2021-02-26T16:35:39.925Z caller=node_exporter.go:113 collector=boottime level=info ts=2021-02-26T16:35:39.925Z caller=node_exporter.go:113 collector=cpu level=info ts=2021-02-26T16:35:39.925Z caller=node_exporter.go:113 collector=diskstats level=info ts=2021-02-26T16:35:39.925Z caller=node_exporter.go:113 collector=filesystem level=info ts=2021-02-26T16:35:39.925Z caller=node_exporter.go:113 collector=loadavg level=info ts=2021-02-26T16:35:39.925Z caller=node_exporter.go:113 collector=meminfo level=info ts=2021-02-26T16:35:39.925Z caller=node_exporter.go:113 collector=netdev level=info ts=2021-02-26T16:35:39.925Z caller=node_exporter.go:113 collector=textfile level=info ts=2021-02-26T16:35:39.925Z caller=node_exporter.go:113 collector=time level=info ts=2021-02-26T16:35:39.925Z caller=node_exporter.go:113 collector=uname level=info ts=2021-02-26T16:35:39.926Z caller=node_exporter.go:195 msg="Listening on" address=:9100 level=info ts=2021-02-26T16:35:39.926Z caller=tls_config.go:191 msg="TLS is disabled." http2=false
更多exporters: https://prometheus.io/docs/instrumenting/exporters/
prometheus会主动从应用拉取数据, 所以我们需要配置prometheus。
vim /usr/local/etc/prometheus.yml
1
2
3
4
5
6
7
8
9
10
11
12
13
14
15
16
17
18
19
20
21
22
23
24
25
26
27
28
29
30
31
32
33
34
35
36
global: # 默认每隔15秒执行一次表达式判断告警规则 scrape_interval: 15s # 默认每隔15秒向各个监控端点拉取一次指标数据 evaluation_interval: 15s # scrape_timeout is set to the global default (10s). # Attach these labels to any time series or alerts when communicating with # external systems (federation, remote storage, Alertmanager). external_labels: monitor: 'codelab-monitor' rule_files: # 表达式计算和记录,告警规则等自定义的配置文件 # - "first.rules" # - "second.rules" # A scrape configuration containing exactly one endpoint to scrape: # Here it's Prometheus itself. scrape_configs: - job_name: "prometheus" static_configs: # 两个监控的端点,9090是Prometheus自己,9100是机器的监控组件Node Exporter - targets: ['127.0.0.1:9090', '127.0.0.1:9100'] - job_name: 'demo-java' # job name metrics_path: '/actuator/prometheus' # 指标获取路径, 默认 '/metrics' scrape_interval: 5s # pull模式, 抓取间隔 # basic_auth: # Spring Security basic auth # username: 'actuator' # password: 'actuator' static_configs: - targets: ['127.0.0.1:8080'] # 实例的地址,默认的协议是http labels: instance: demo-java
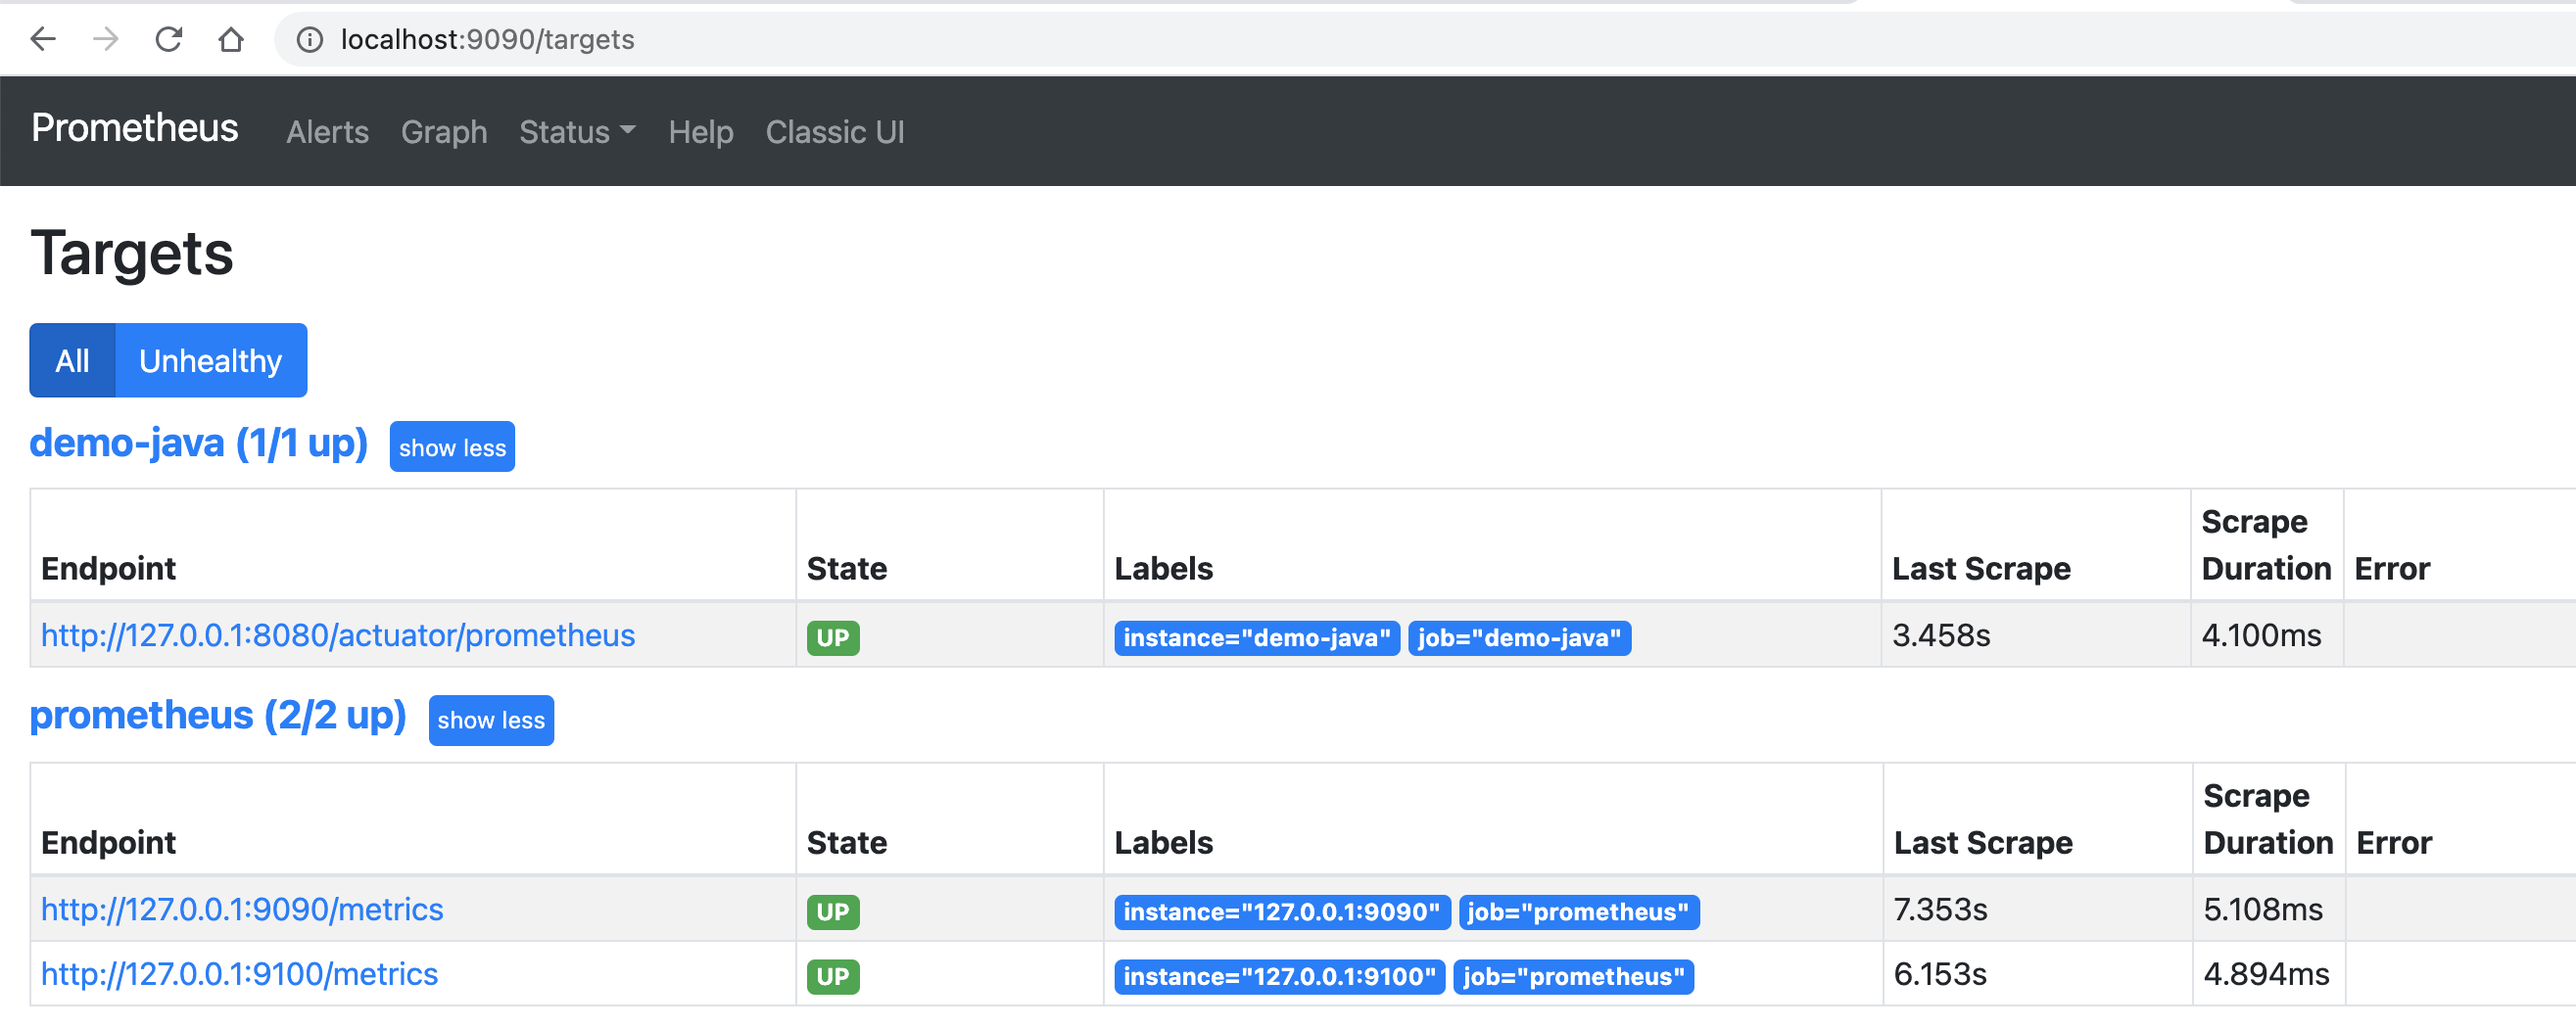
访问 http://localhost:9090/targets 查看实例
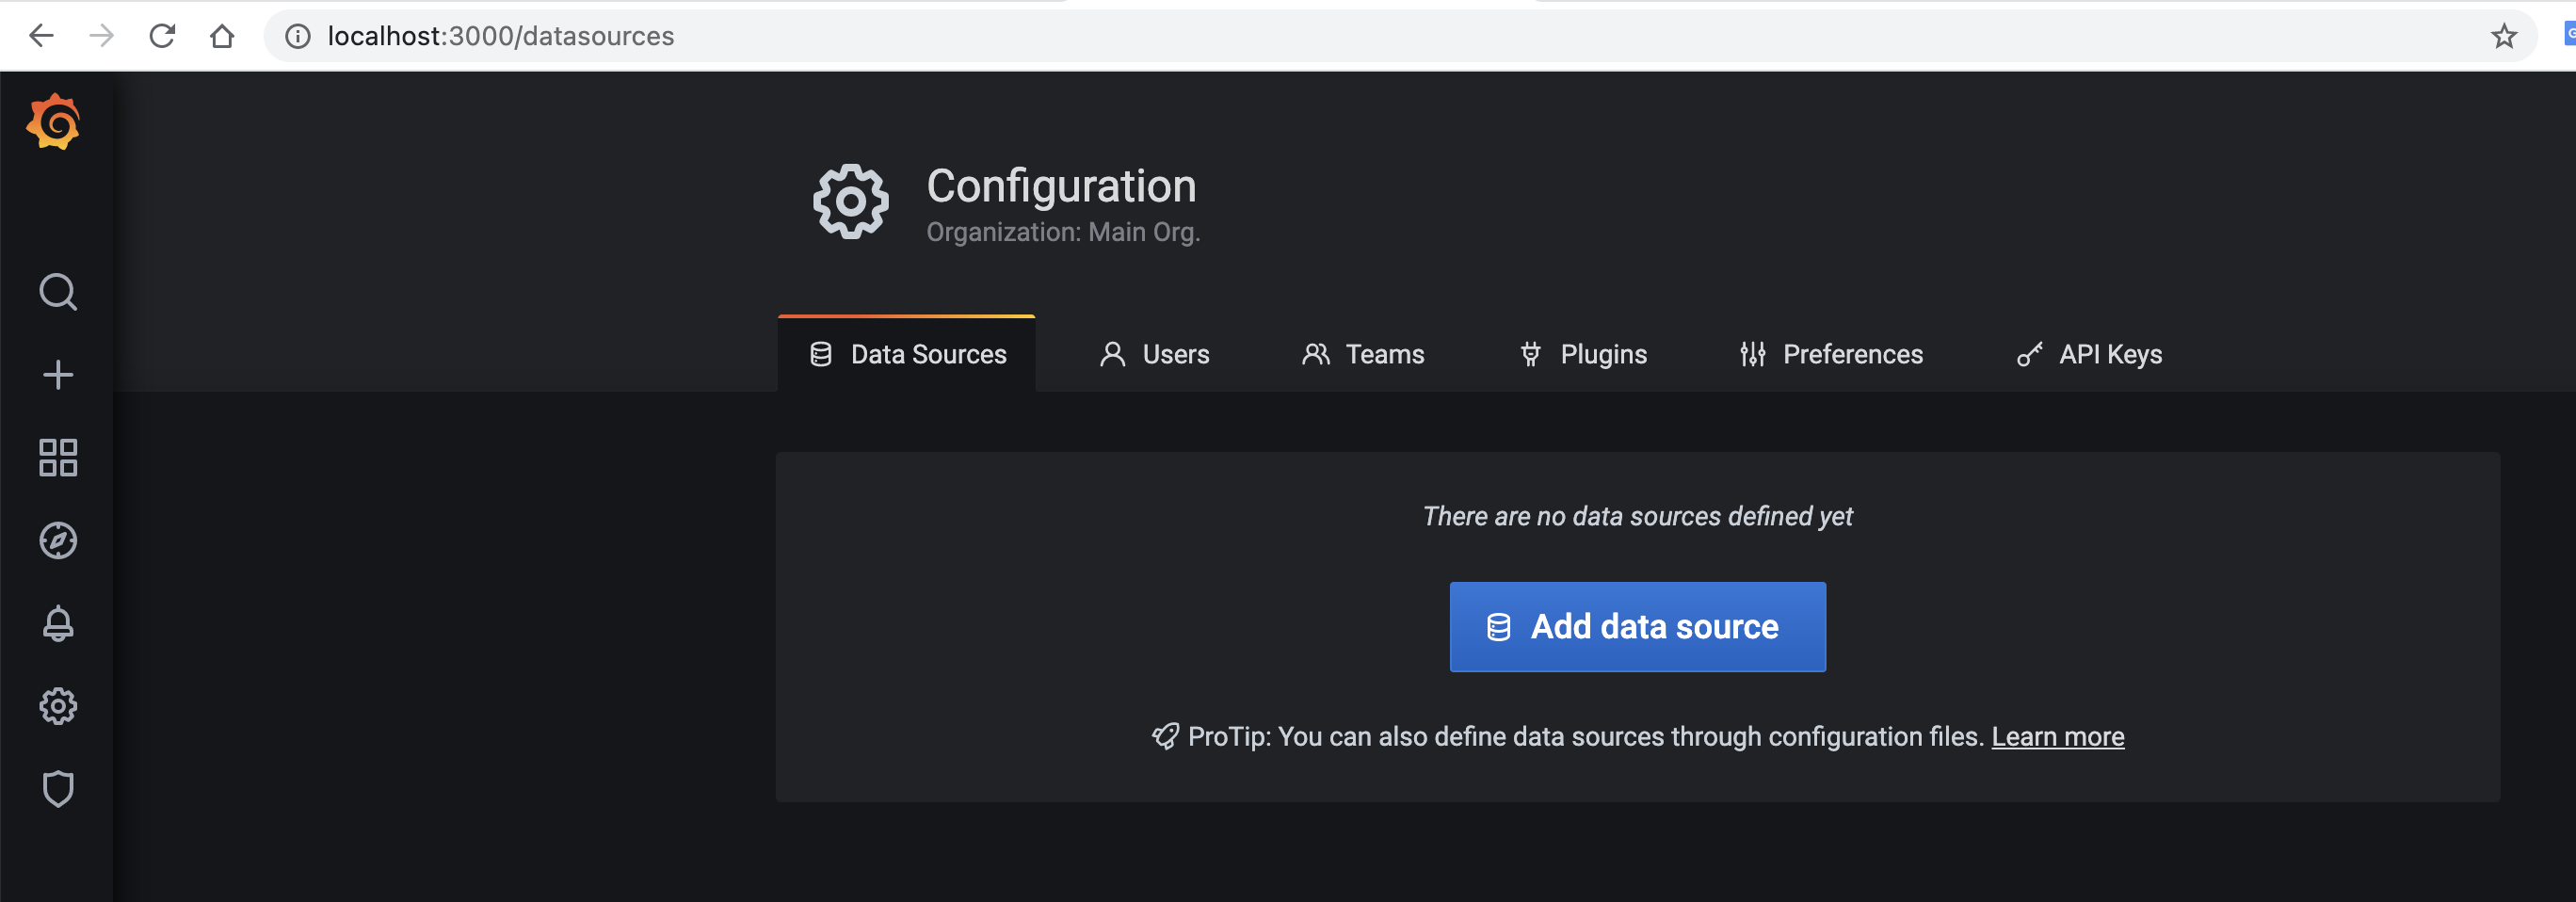
grafana默认帐号密码 admin/admin, 访问 http://localhost:3000/ 登录
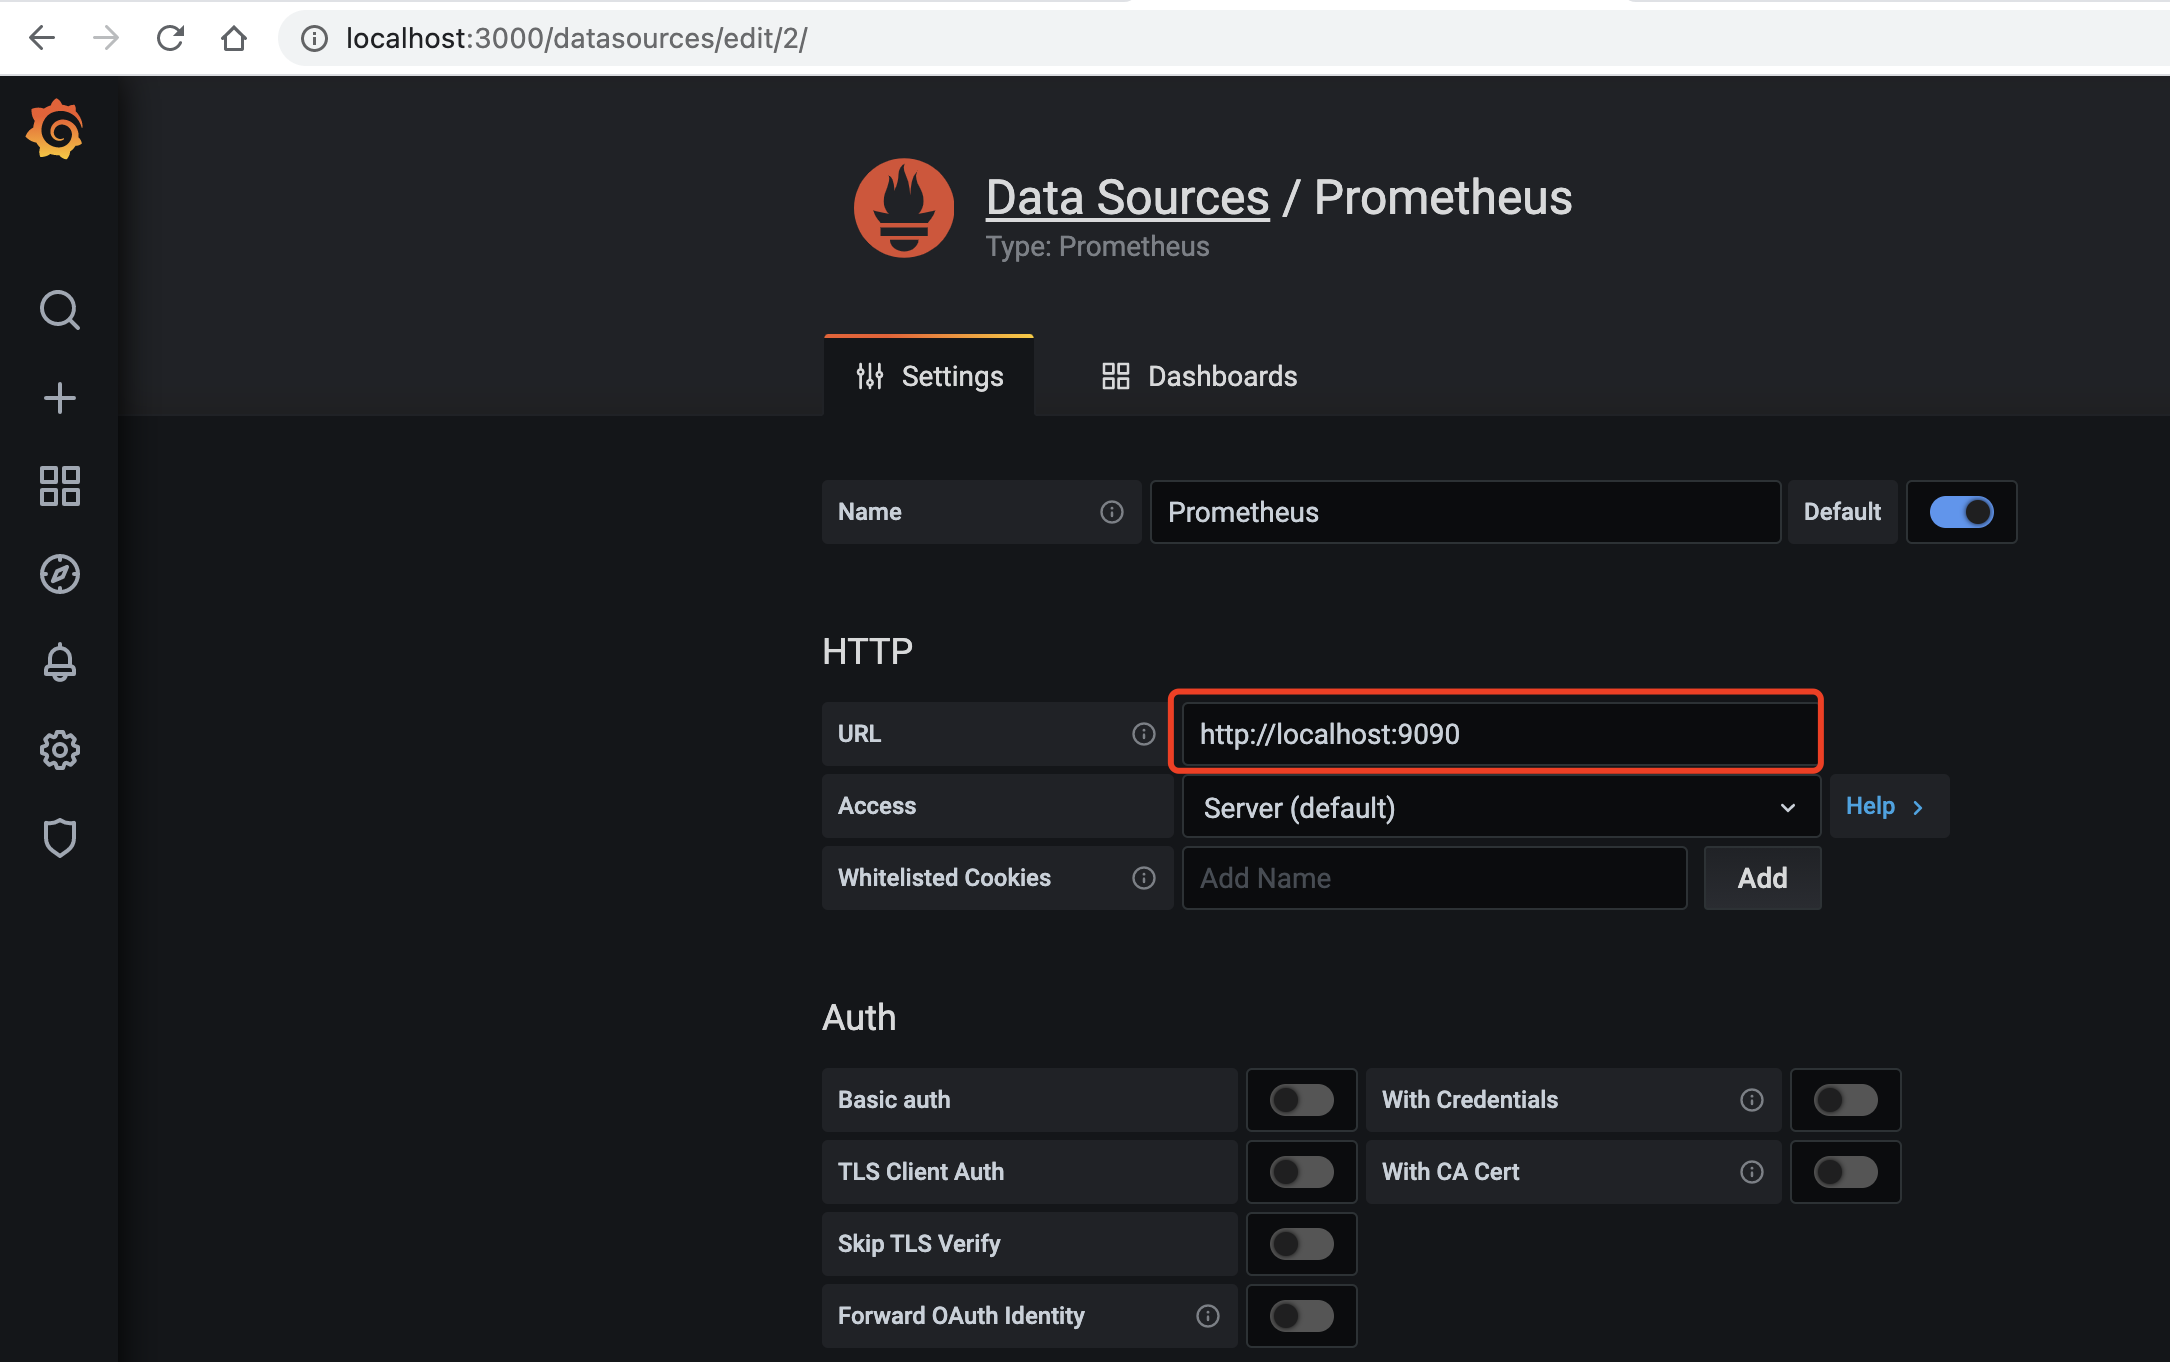
配置数据源
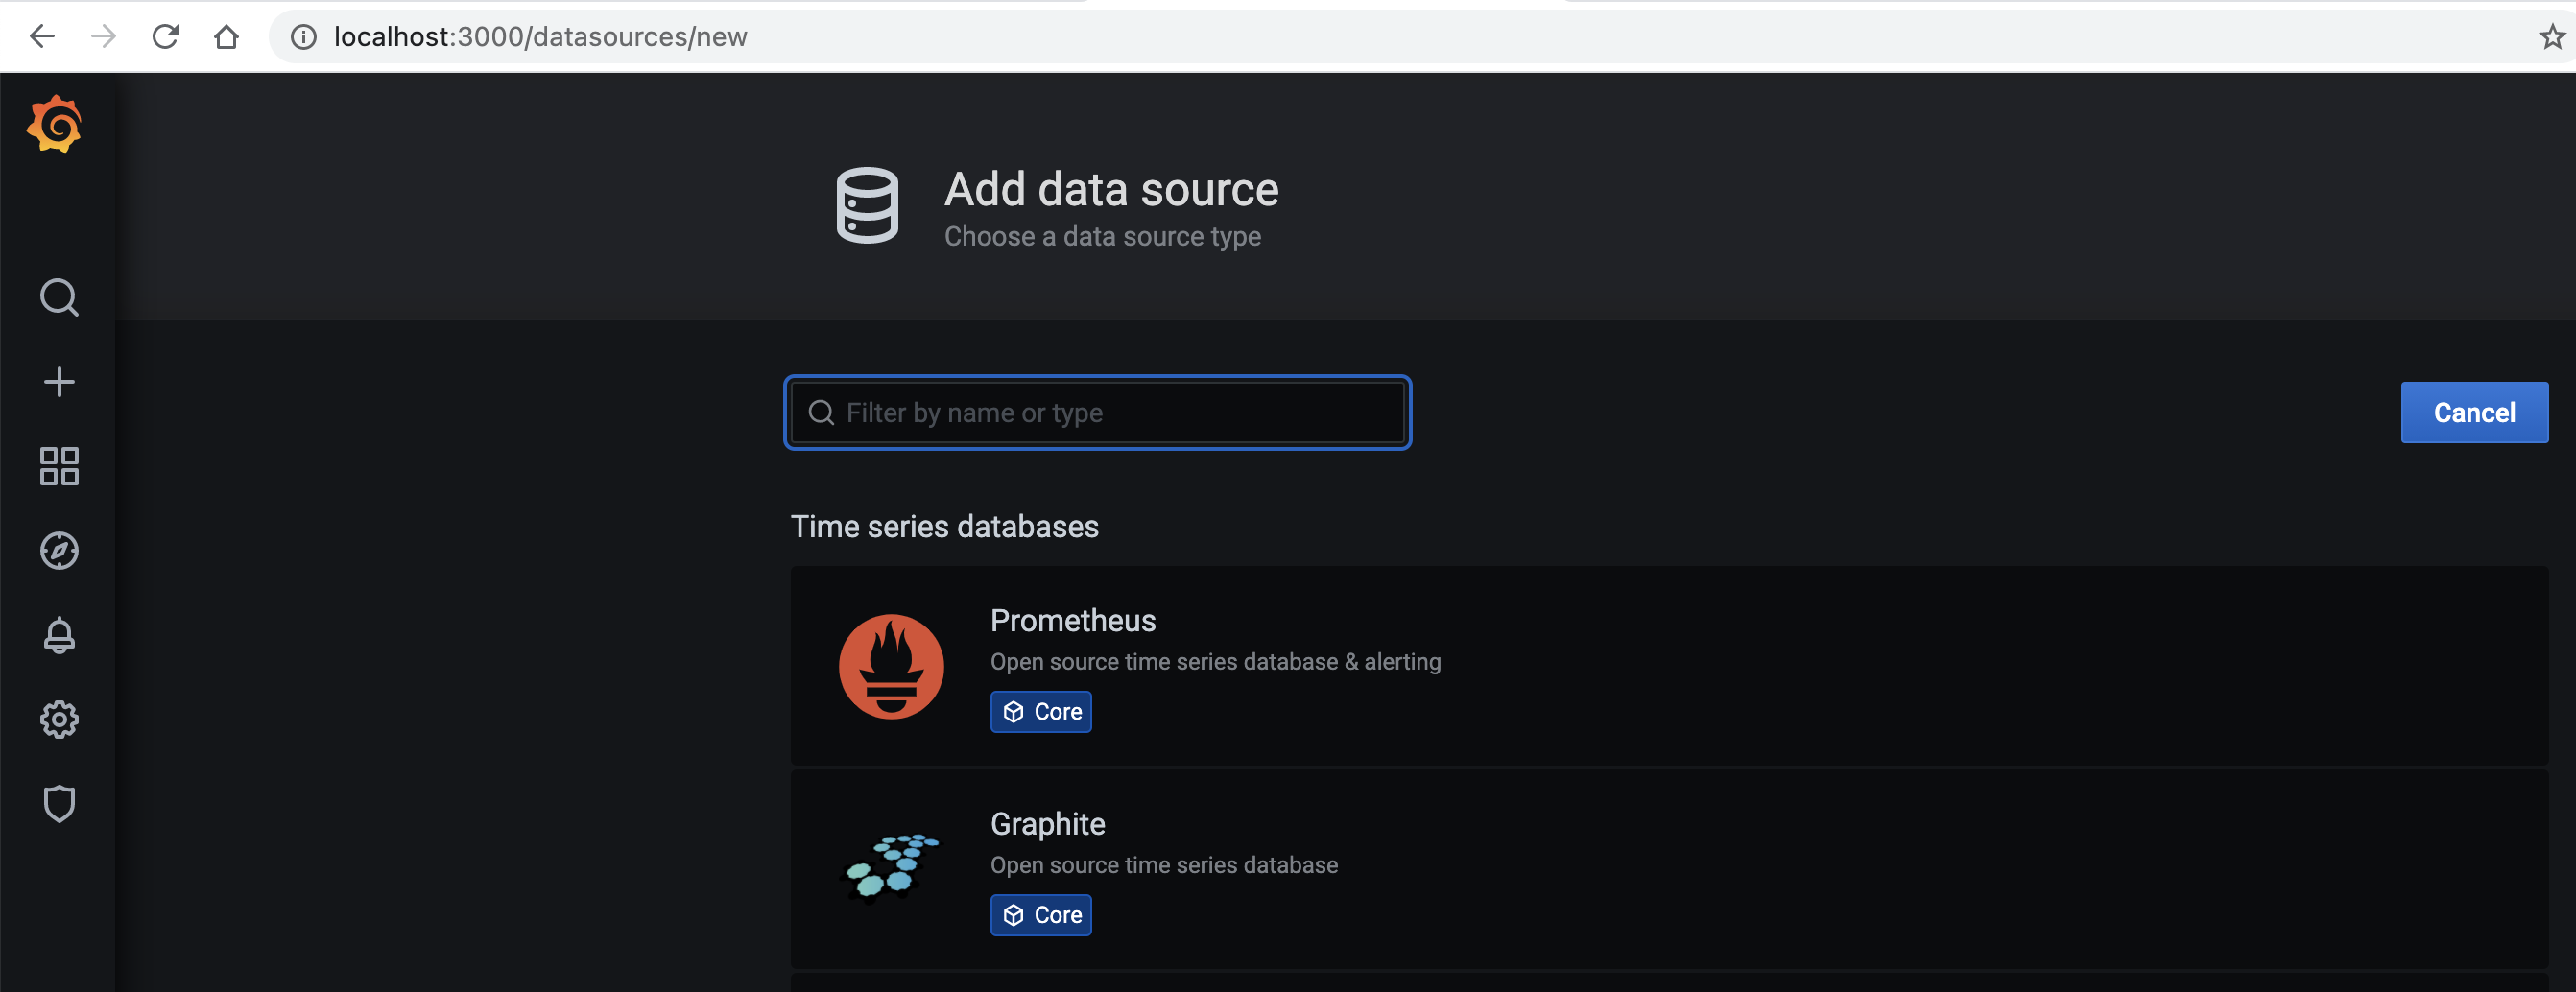
这里我们选择 prometheus
填写prometheus地址 http://localhost:9090
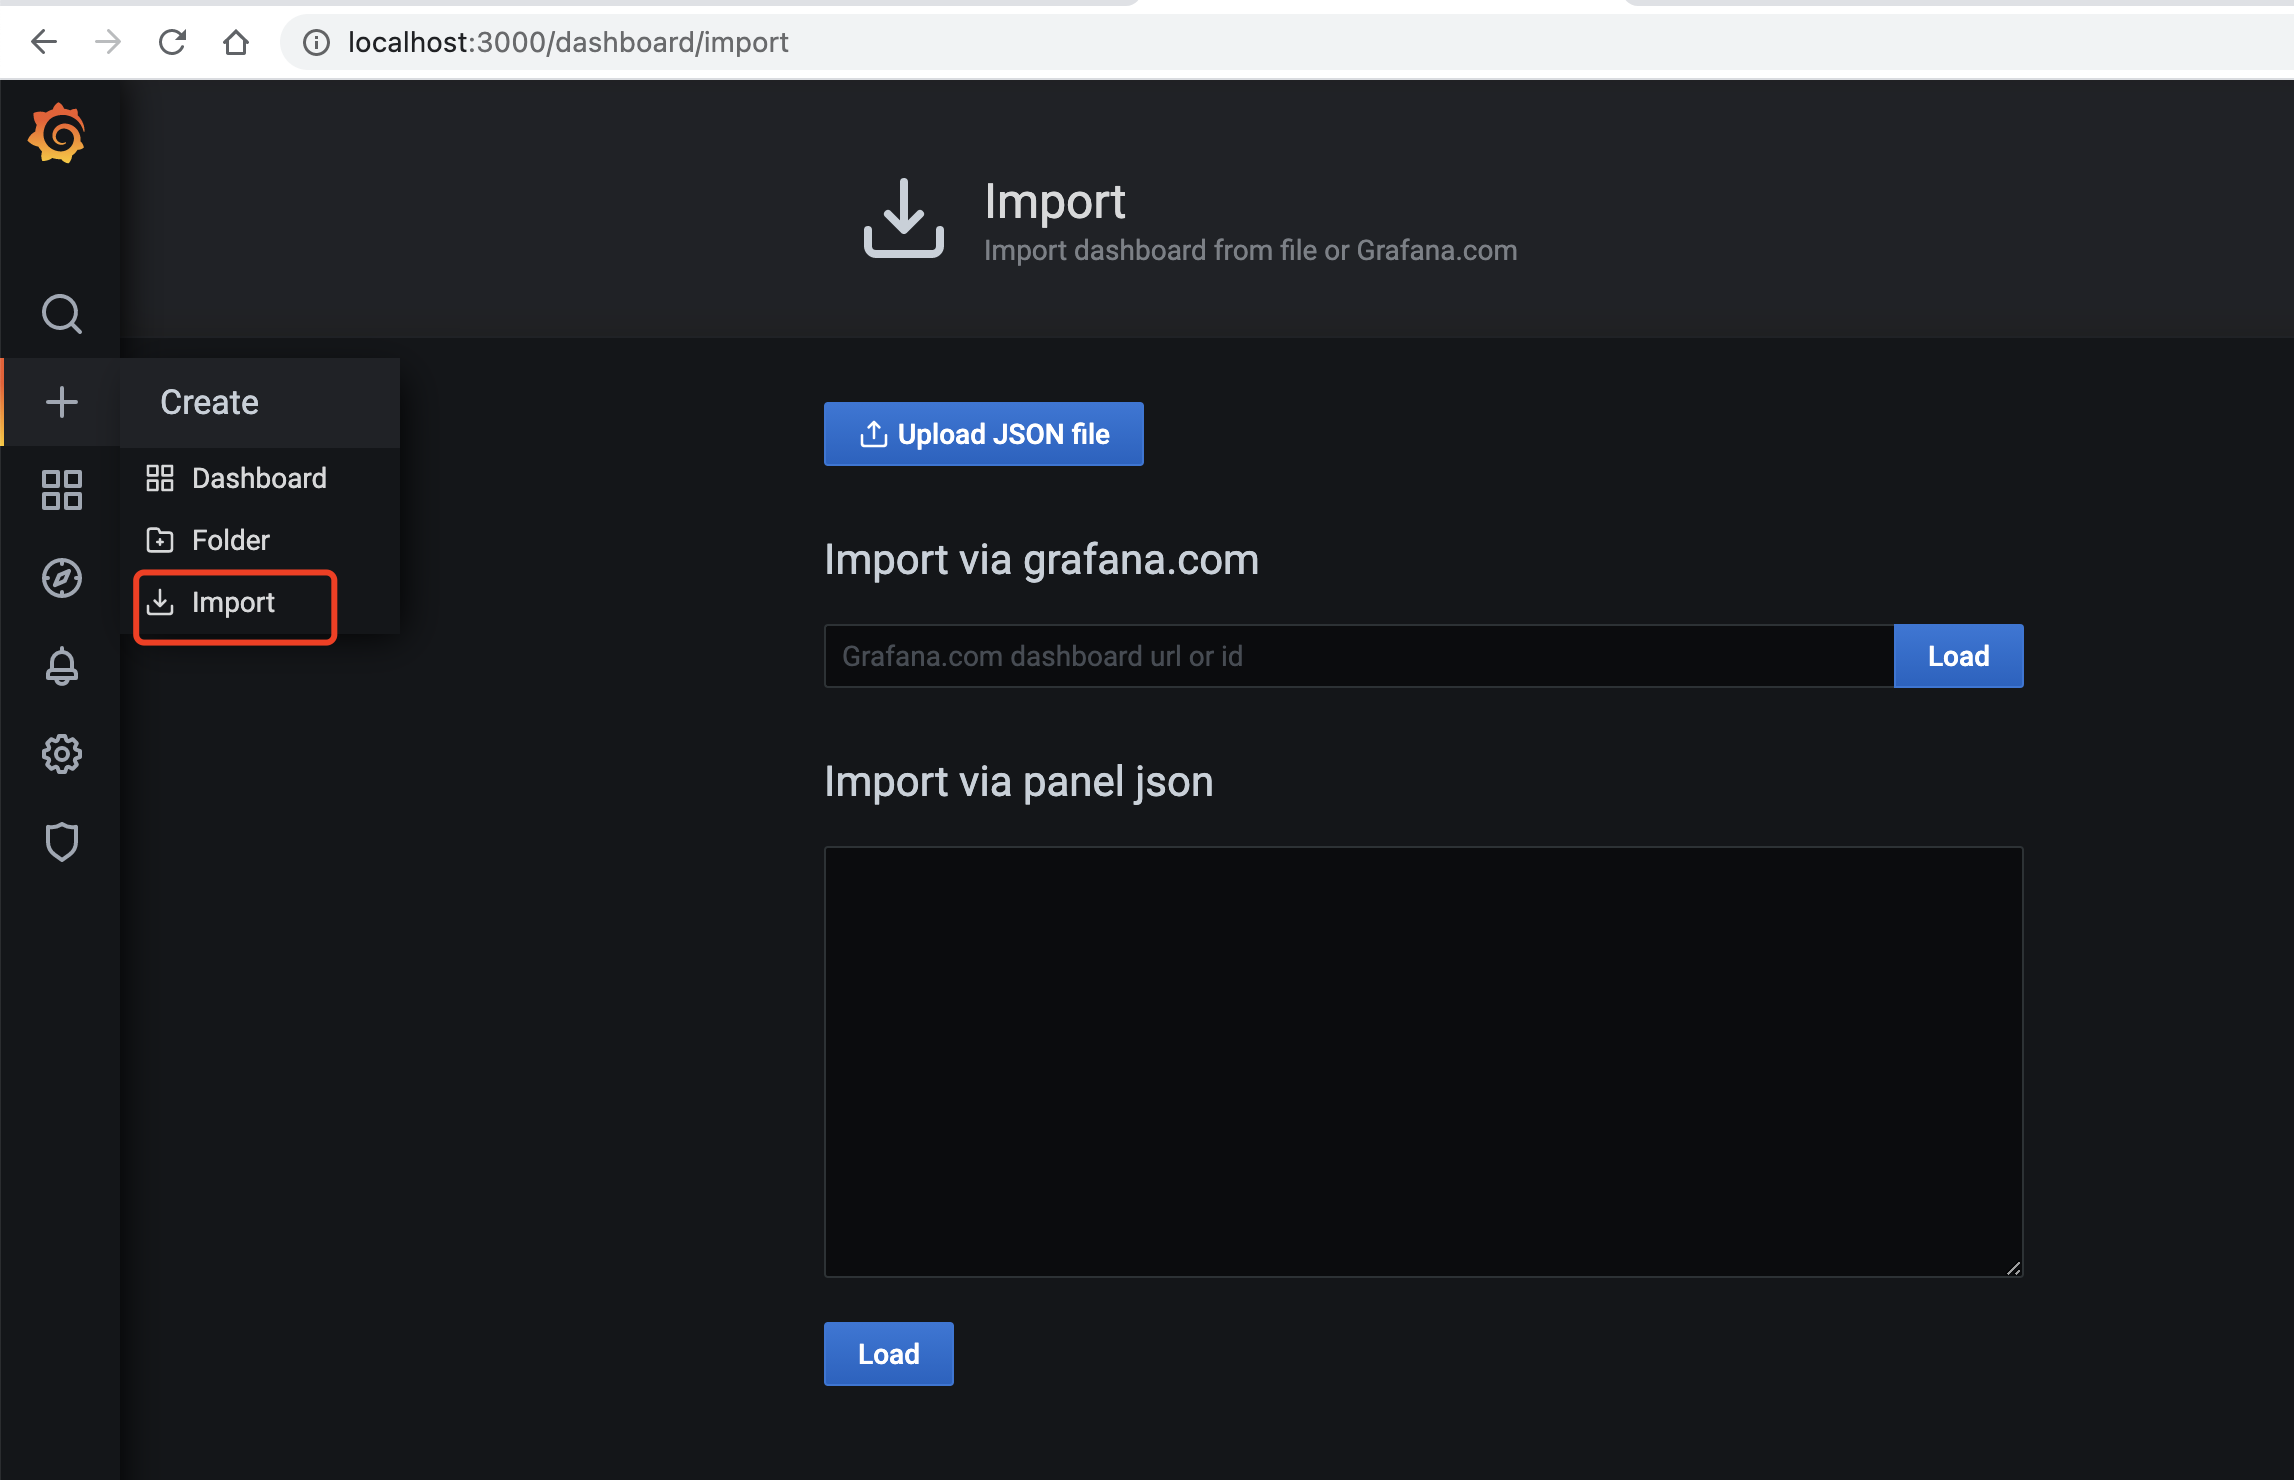
导入dashboard
访问 https://grafana.com/grafana/dashboards 选择 dashboard 主题.
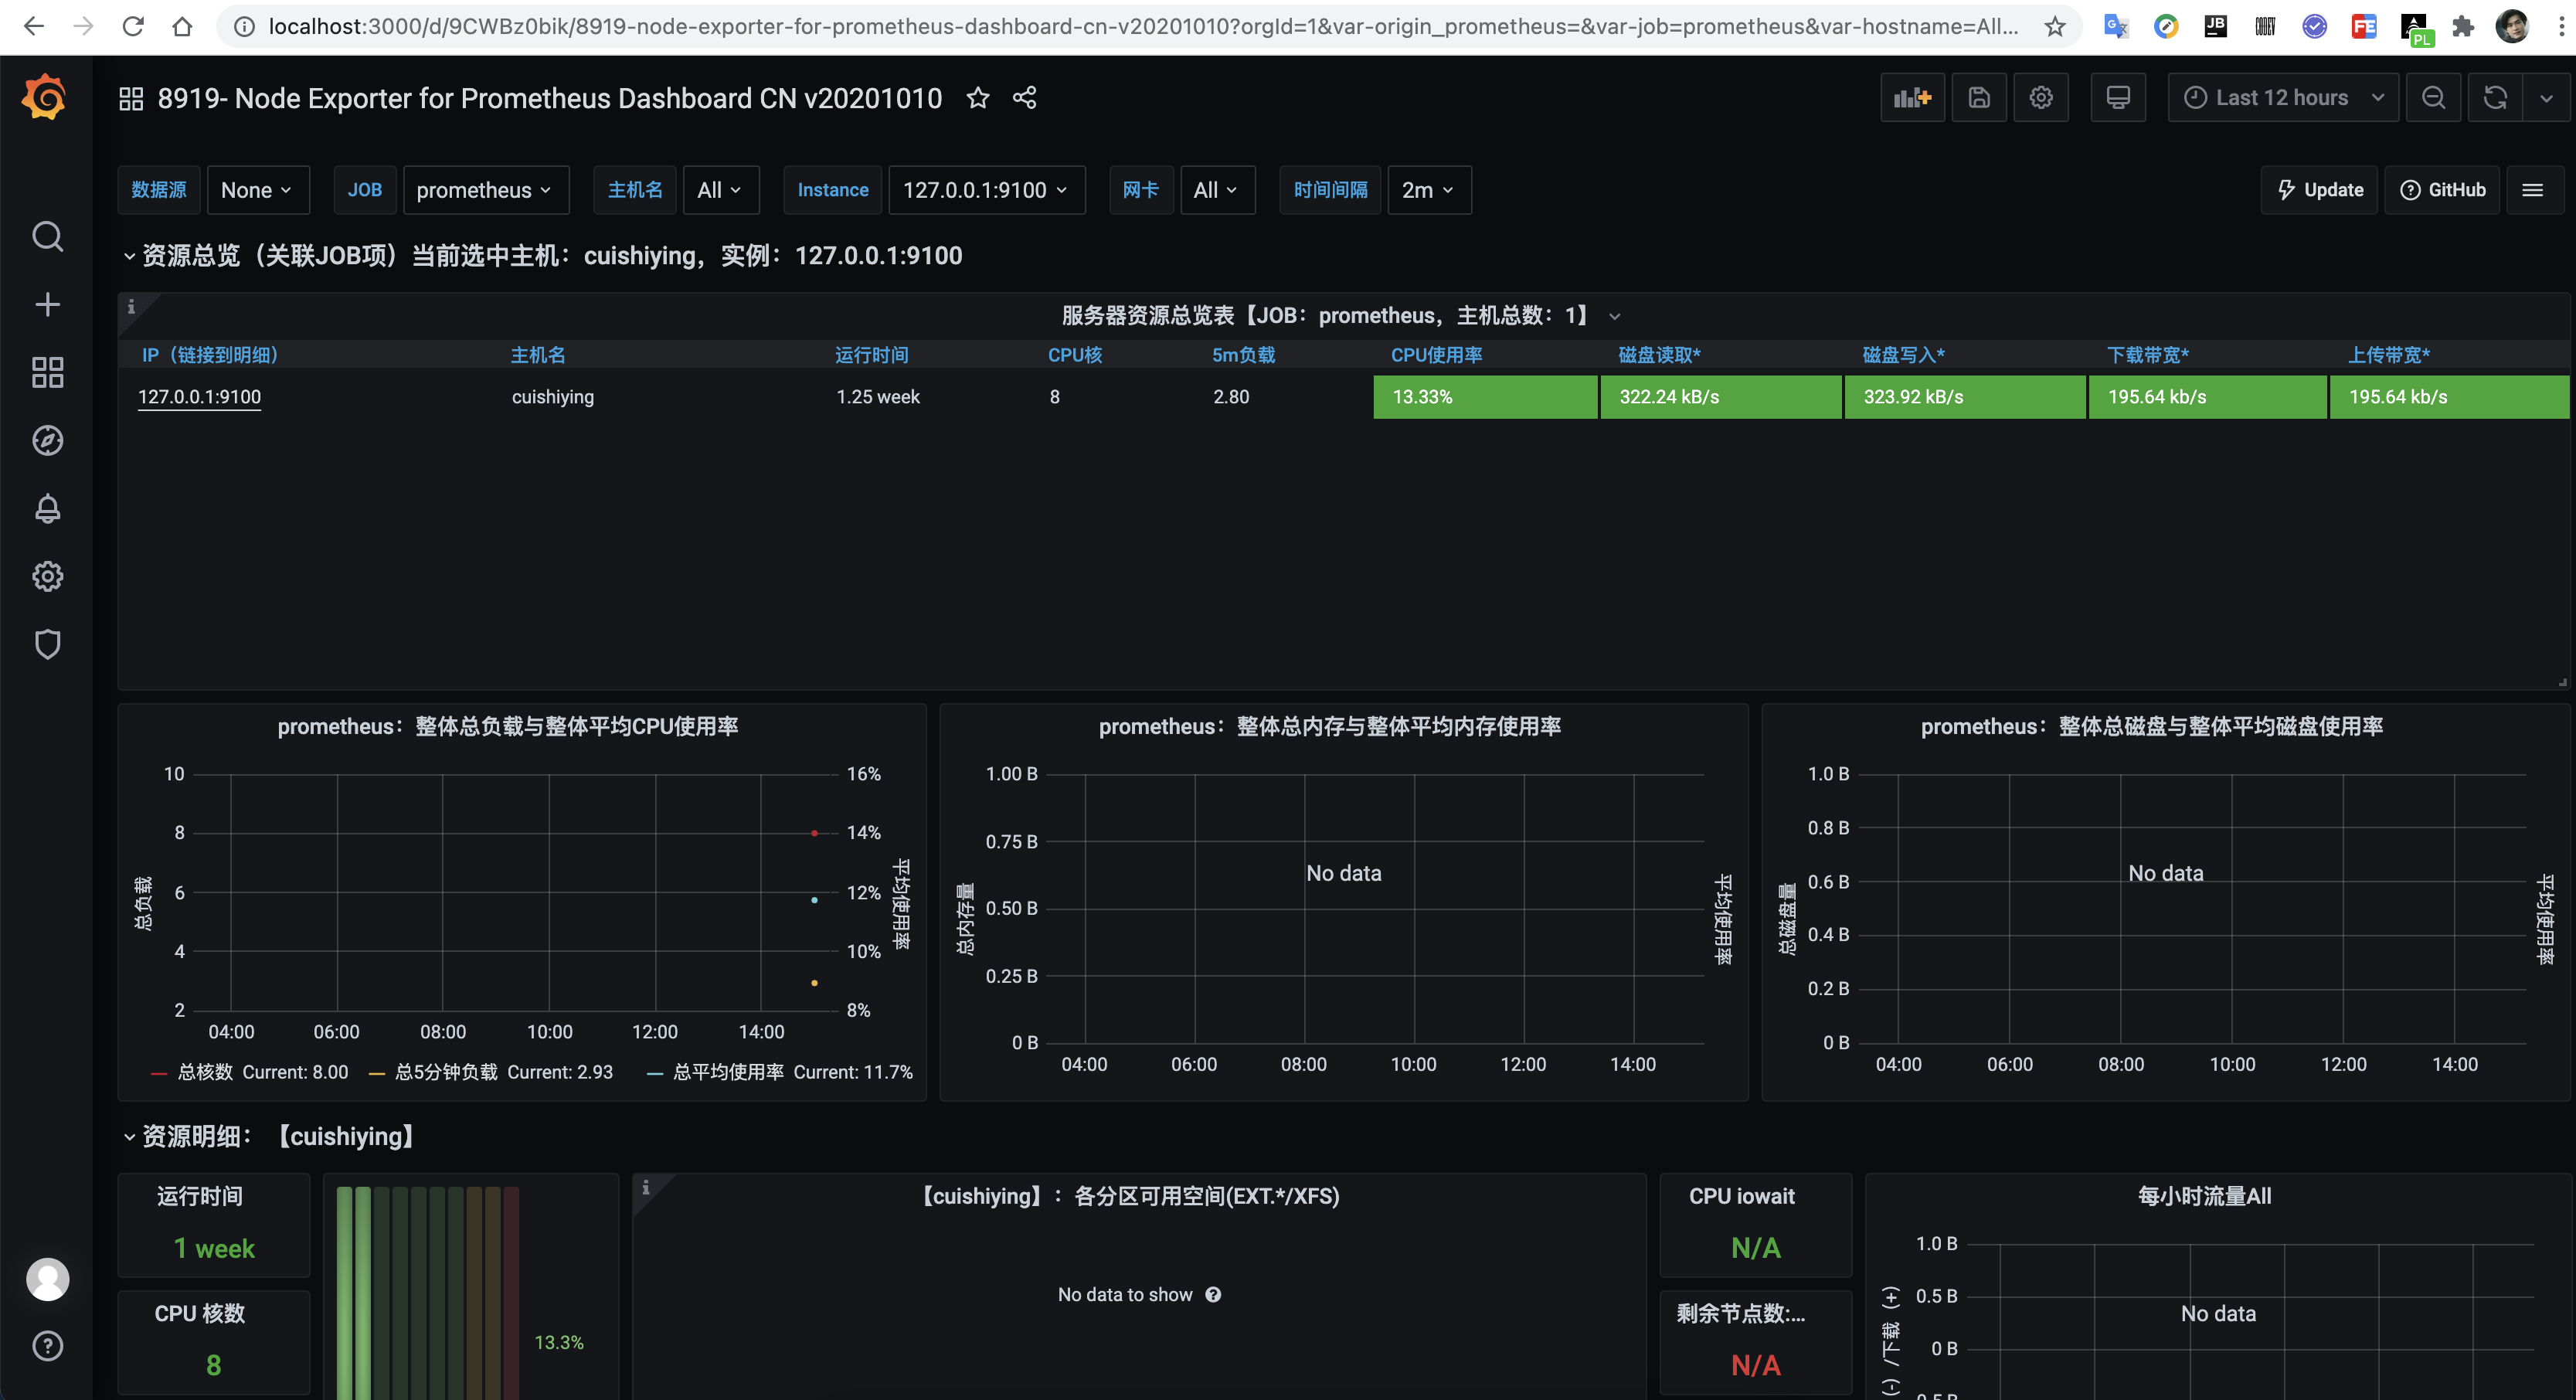
8919主题
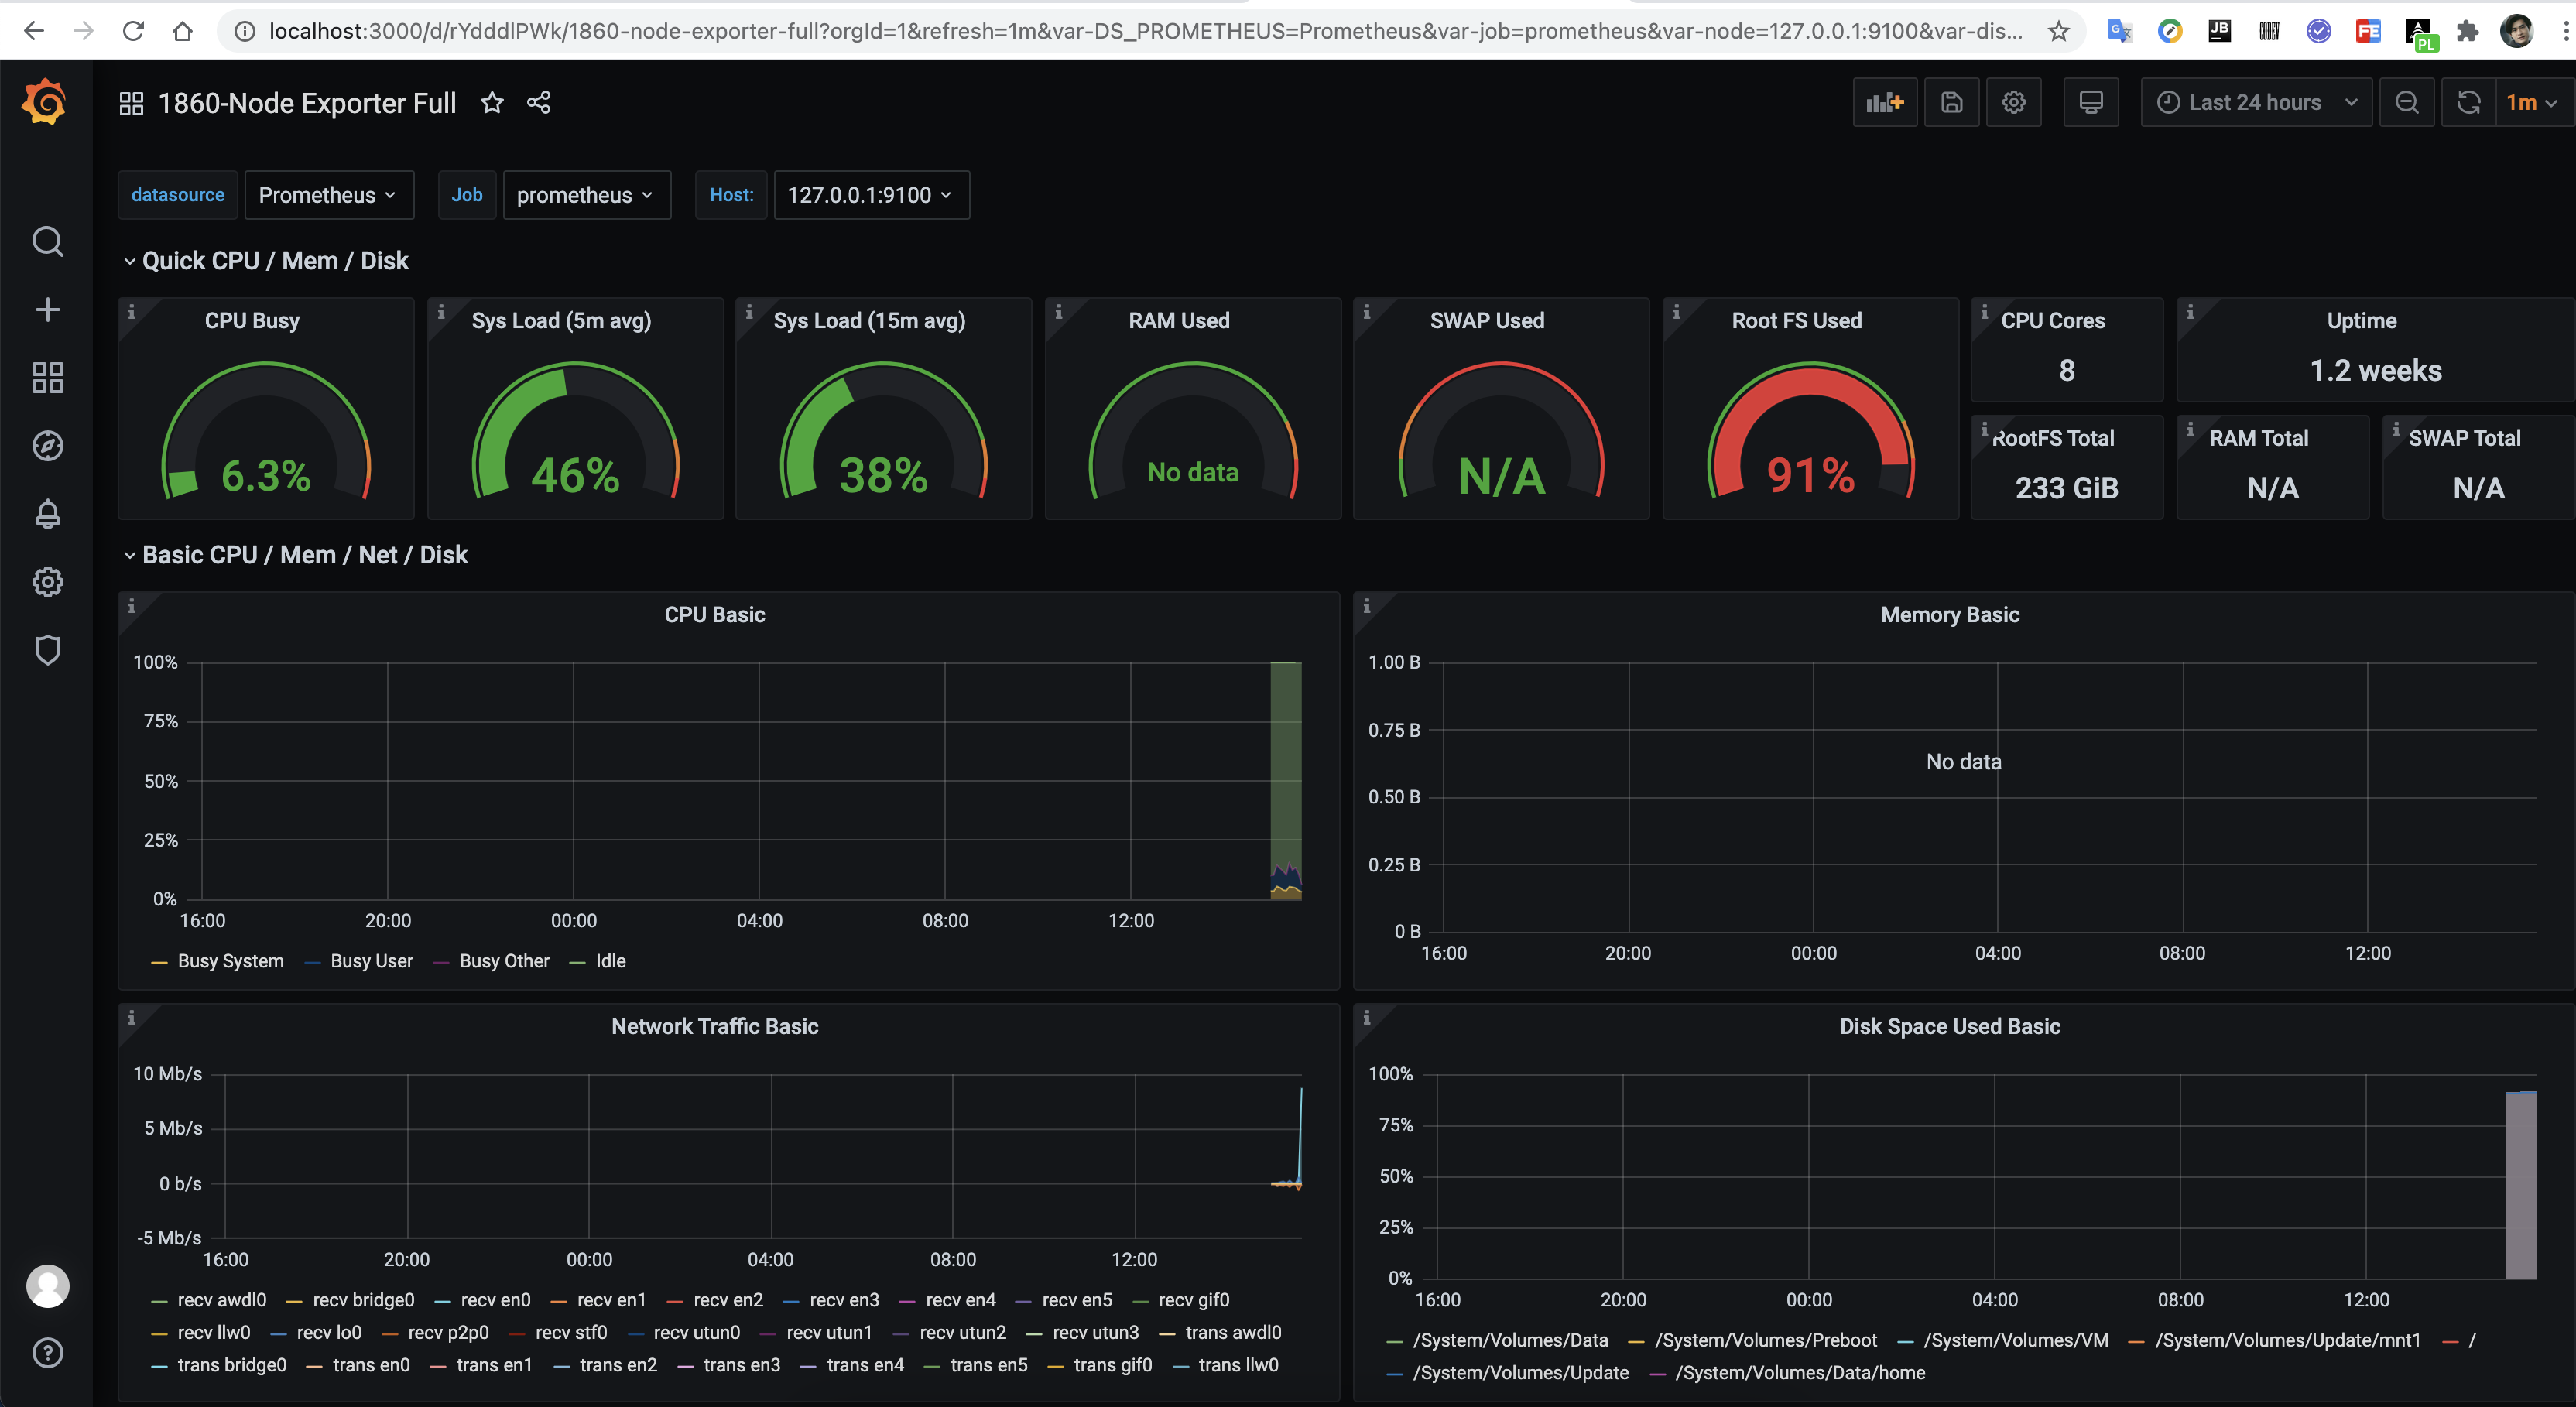
1860主题
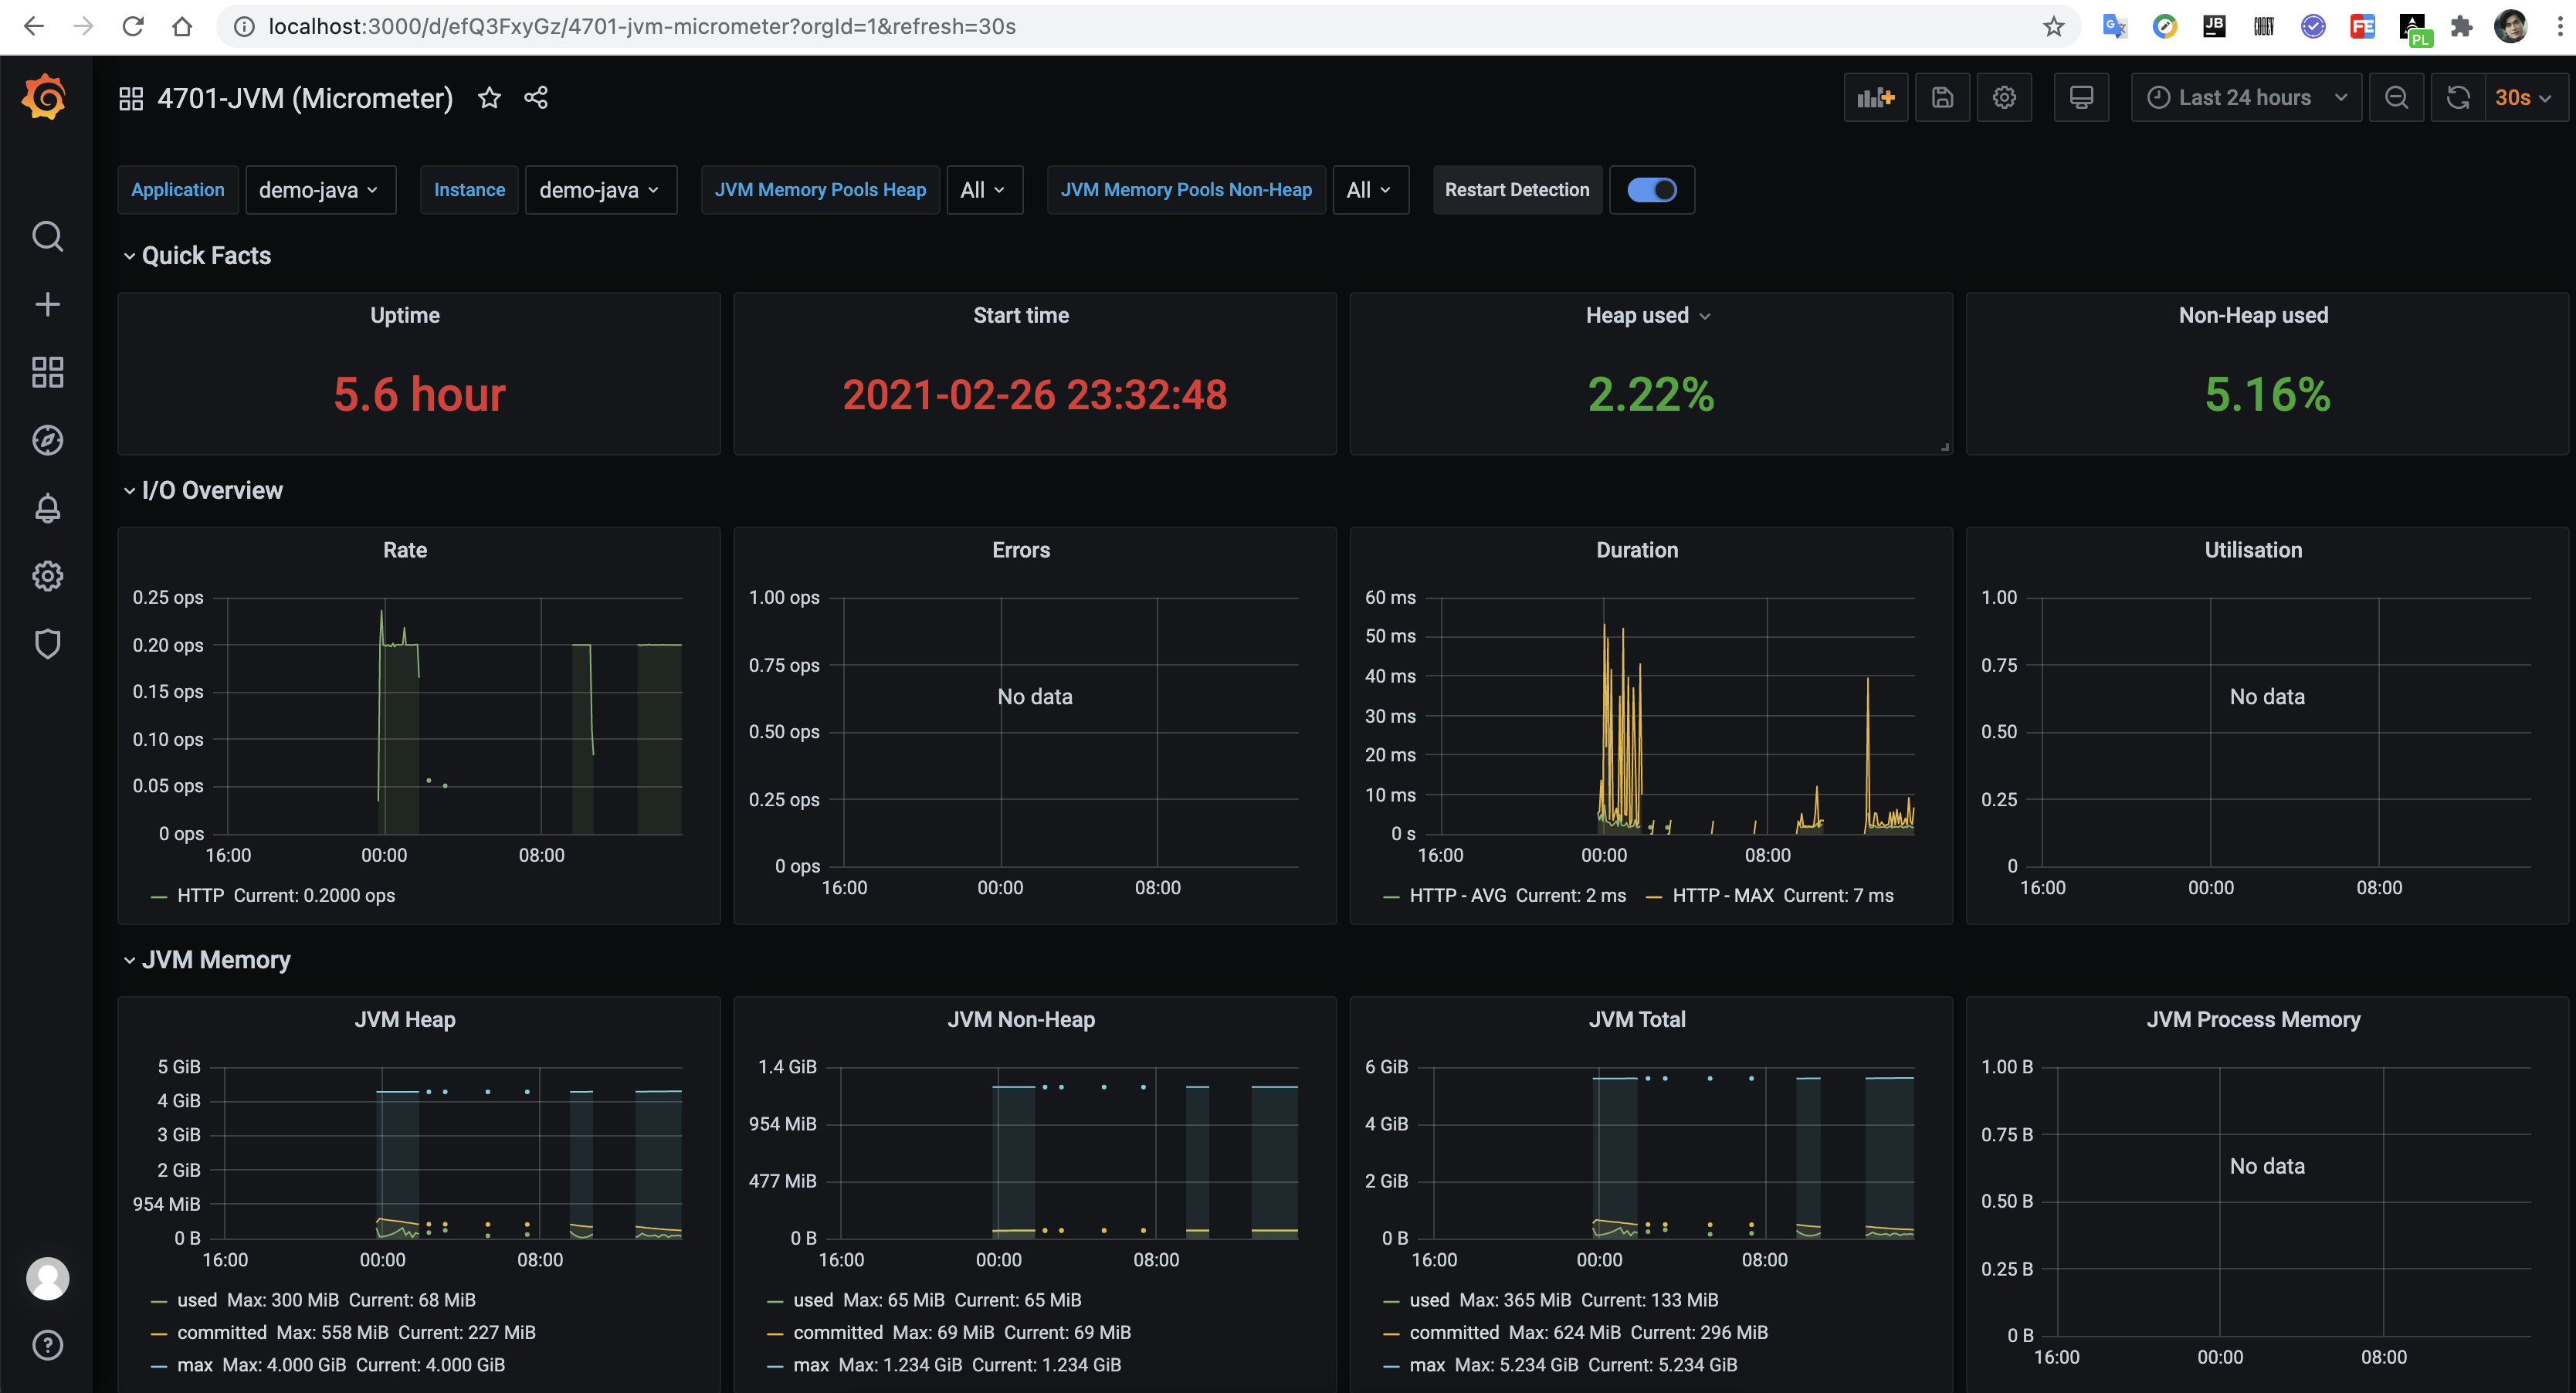
4701主题
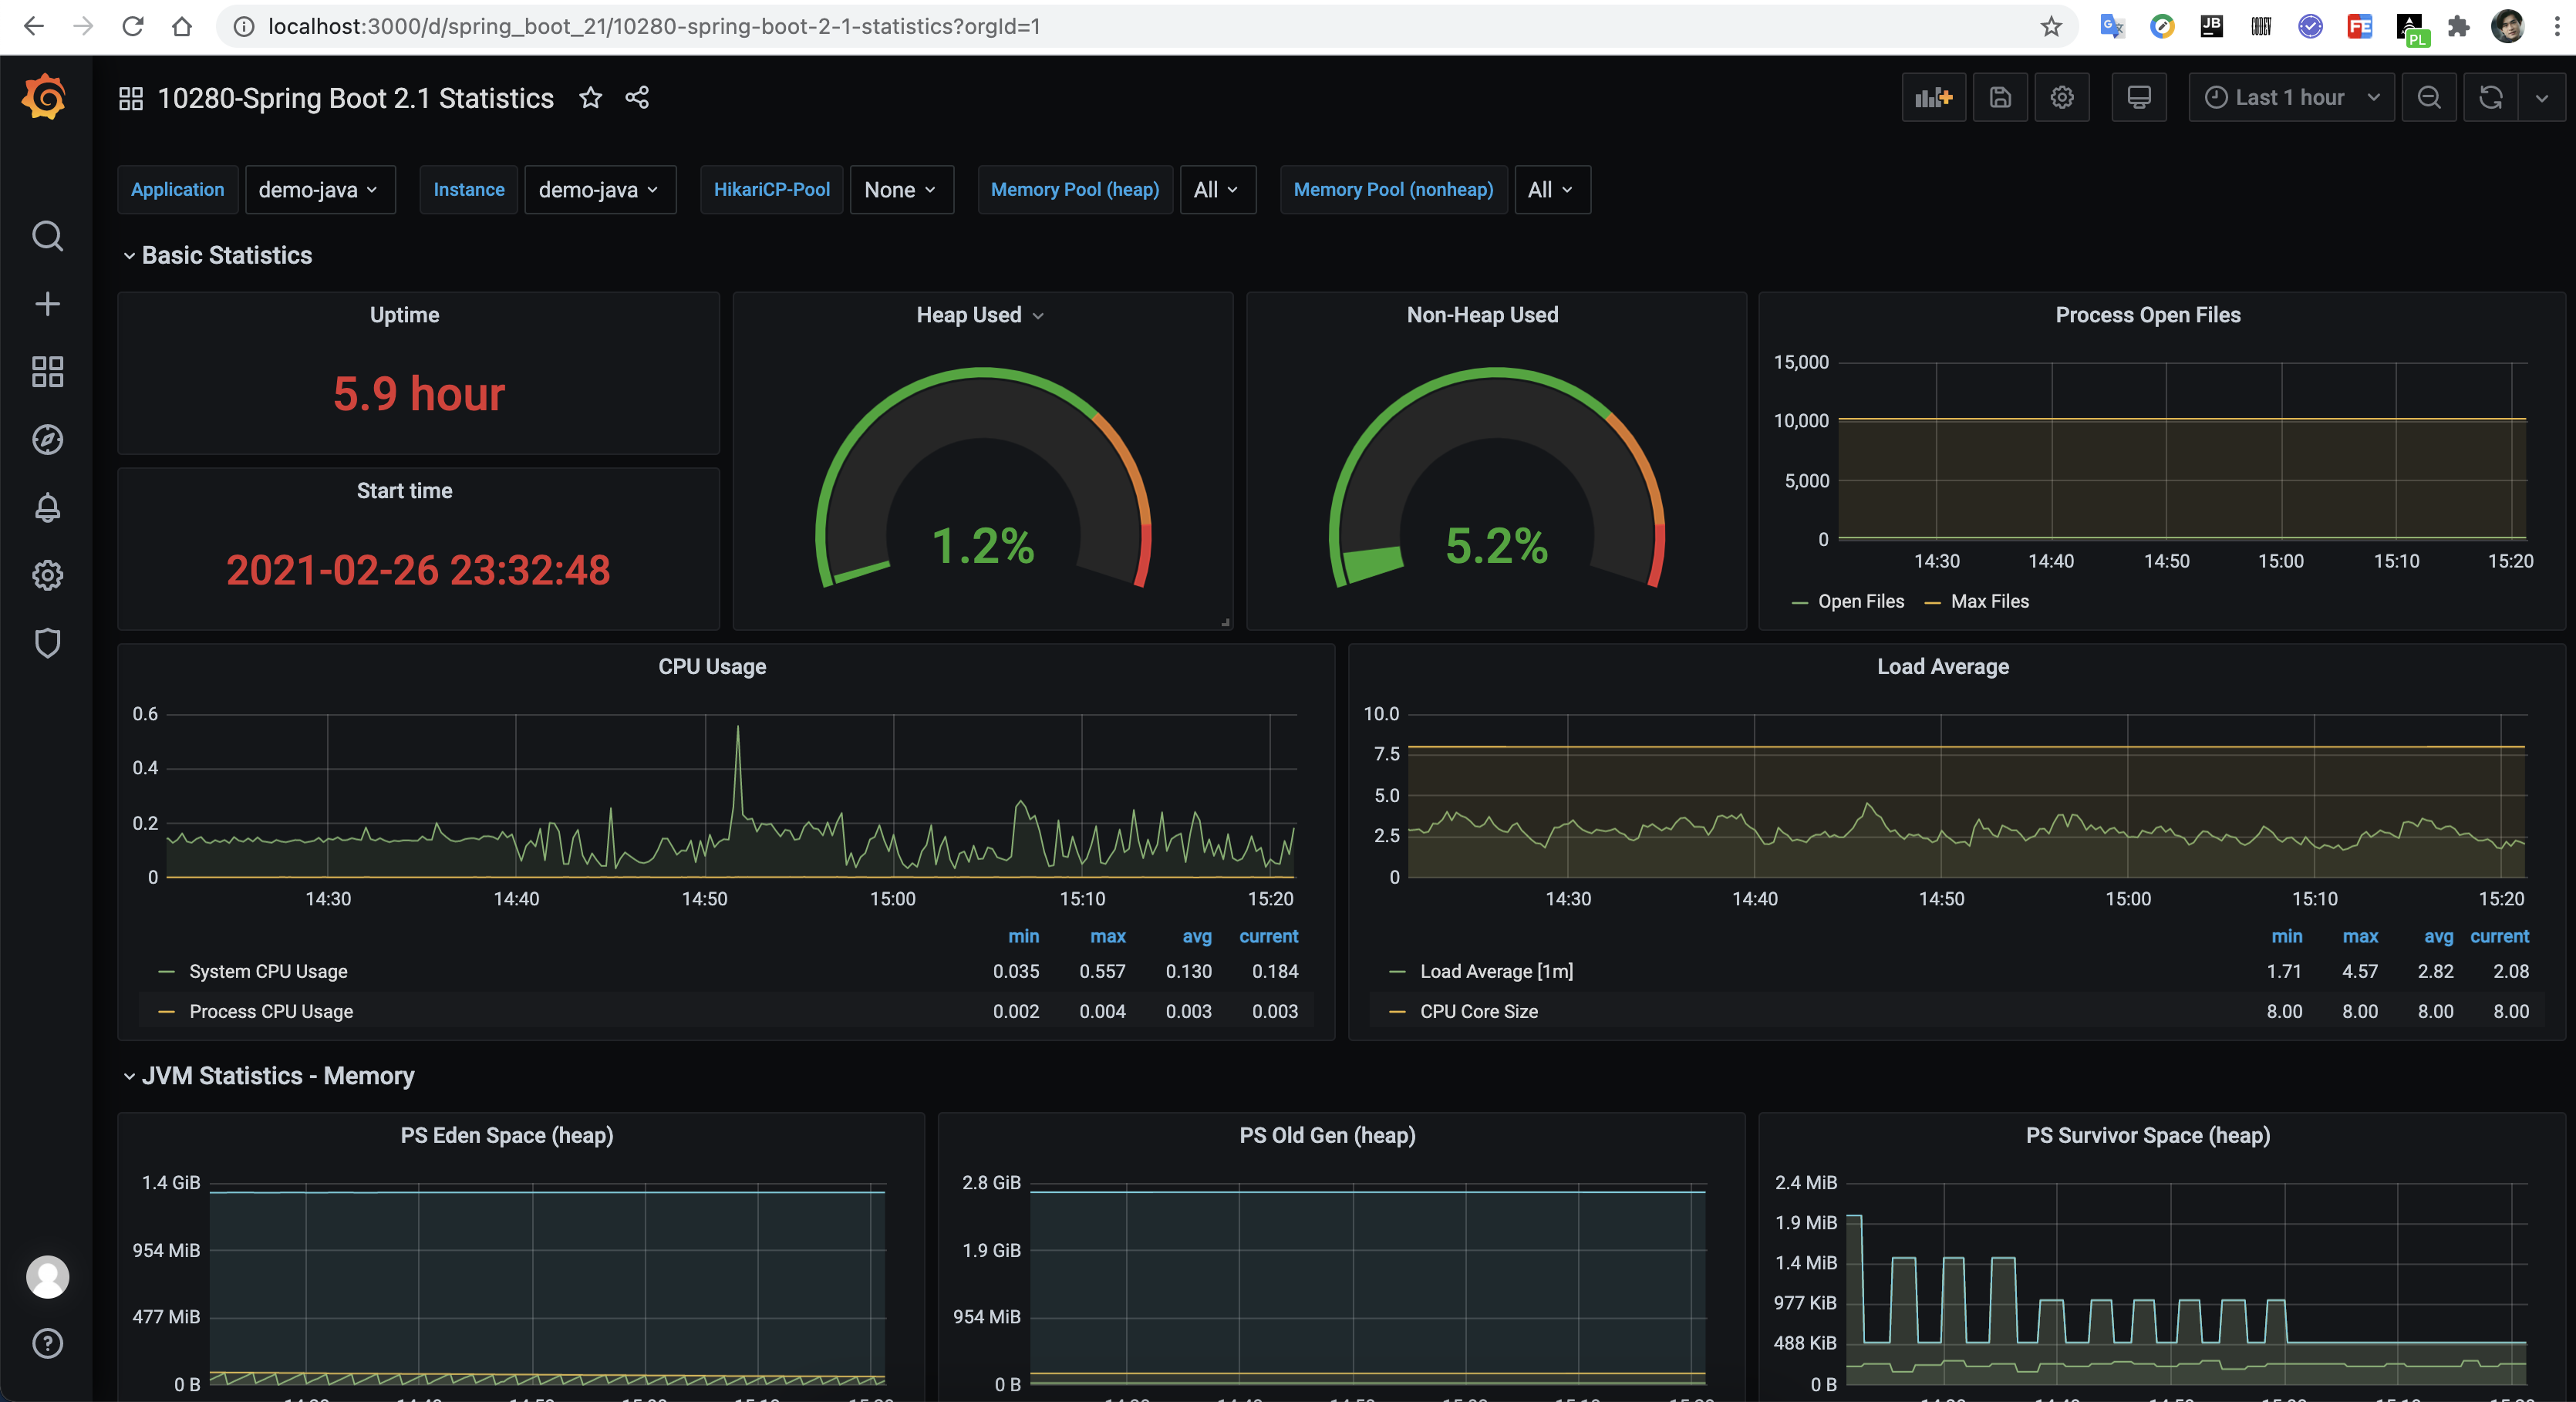
10280主题
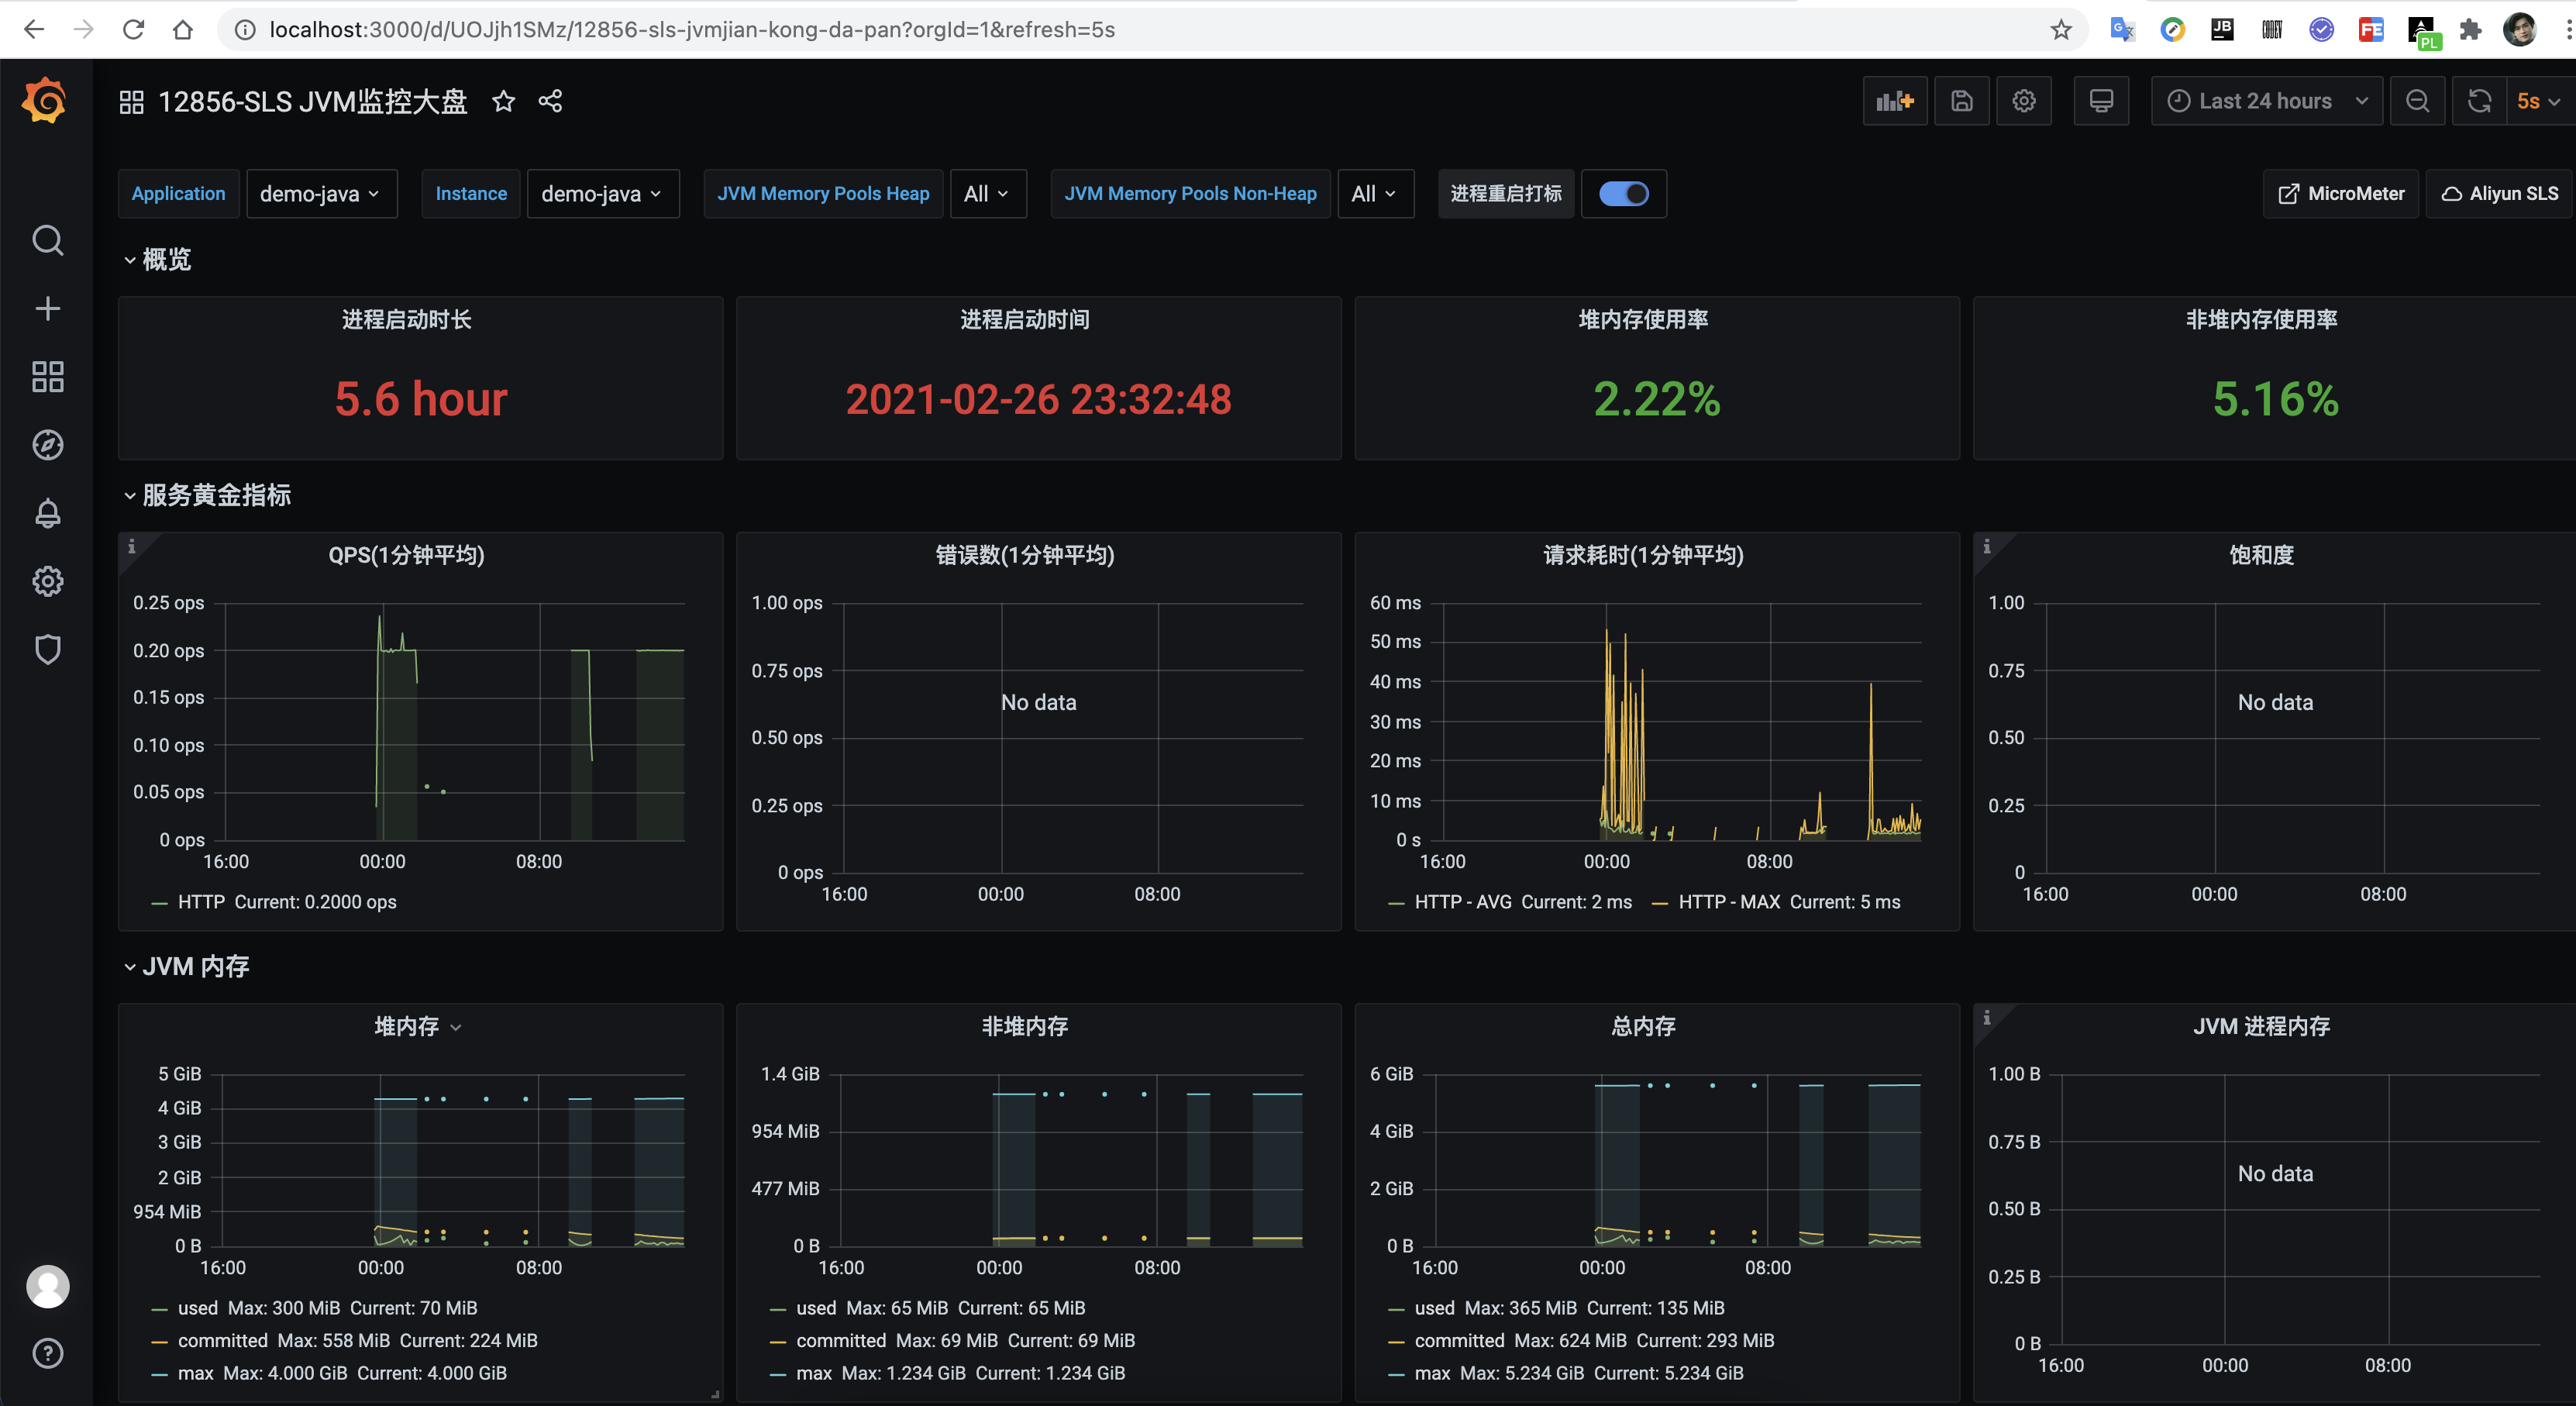
12856主题
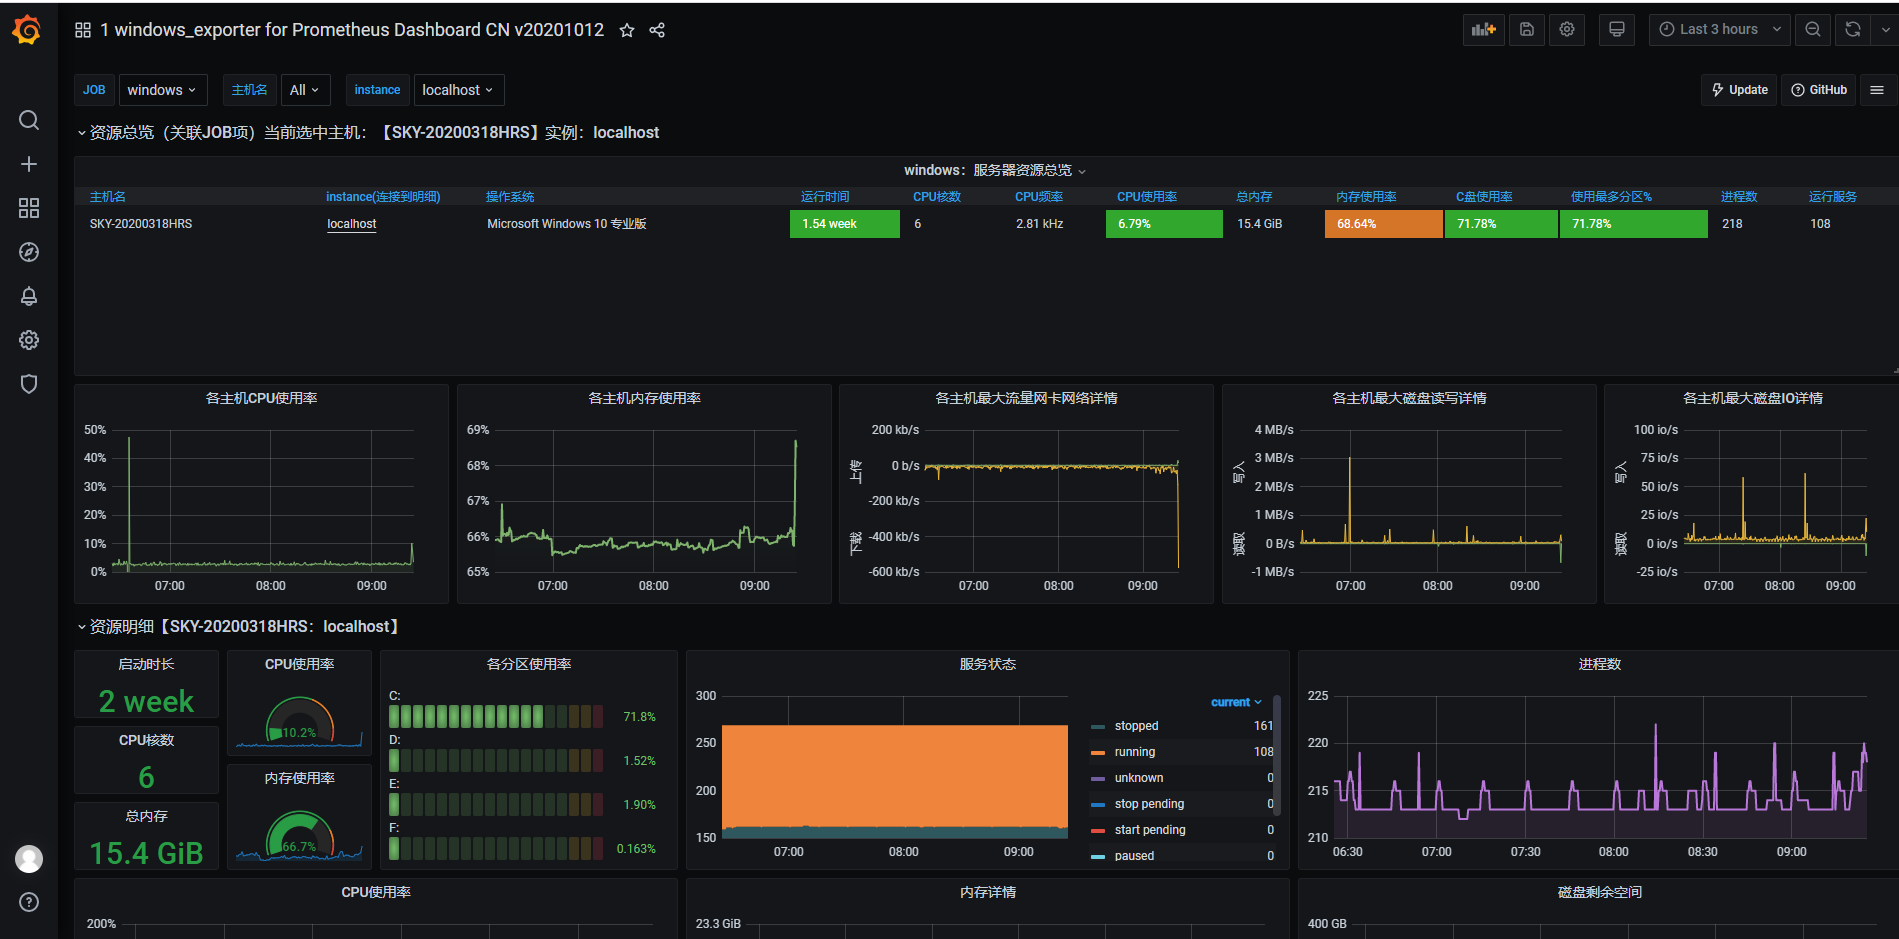
我们以 windows 环境为例
prometheus
1 docker run -d --name=prometheus -p 9090:9090 -v E:/docker/prometheus/prometheus.yml:/etc/prometheus/prometheus.yml prom/prometheus
下载(https://github.com/prometheus/node_exporter )并运行node_exporter。metrix地址 http://192.168.141.1:9182/metrics
prometheus.yml
1 2 3 4 5 6 7 8 9 10 11 12 13 14 15 16 17 18 19 20 21 22 23 24 25 26 27 28 29 30 31 32 33 34 35 36 37 38 39 40 41 42 global: scrape_interval: 15s evaluation_interval: 15s external_labels: monitor: 'codelab-monitor' rule_files: scrape_configs: - job_name: 'prometheus' static_configs: - targets: ['host.docker.internal:9090' ] - job_name: 'eachbot-nlp-kb-proxy' metrics_path: '/kbp/actuator/prometheus' static_configs: - targets: ['192.168.141.1:7103' ] labels: instance: eachbot-nlp-kb-proxy - job_name: windows static_configs: - targets: ['192.168.141.1:9182' ] labels: instance: localhost
grafana
1 docker run -d --name=grafana --restart=always -p 3000:3000 grafana/grafana
选择windows下dashboard主题10467
Prometheus 客户端库主要提供四种主要的 Metrics 类型:
Counter(计数器)
Gauge(测量仪)
Histogram(直方图)
类型为Histogram的监控指标prometheus_tsdb_compaction_chunk_range_bucket。
1
2
3
4
5
6
7
8
9
10
11
12
13
14
15
# HELP prometheus_tsdb_compaction_chunk_range Final time range of chunks on their first compaction # TYPE prometheus_tsdb_compaction_chunk_range histogram prometheus_tsdb_compaction_chunk_range_bucket{le="100"} 0 prometheus_tsdb_compaction_chunk_range_bucket{le="400"} 0 prometheus_tsdb_compaction_chunk_range_bucket{le="1600"} 0 prometheus_tsdb_compaction_chunk_range_bucket{le="6400"} 0 prometheus_tsdb_compaction_chunk_range_bucket{le="25600"} 0 prometheus_tsdb_compaction_chunk_range_bucket{le="102400"} 0 prometheus_tsdb_compaction_chunk_range_bucket{le="409600"} 0 prometheus_tsdb_compaction_chunk_range_bucket{le="1.6384e+06"} 260 prometheus_tsdb_compaction_chunk_range_bucket{le="6.5536e+06"} 780 prometheus_tsdb_compaction_chunk_range_bucket{le="2.62144e+07"} 780 prometheus_tsdb_compaction_chunk_range_bucket{le="+Inf"} 780 prometheus_tsdb_compaction_chunk_range_sum 1.1540798e+09 prometheus_tsdb_compaction_chunk_range_count 780
从样本可以看出, 小于1.6384e+06的样本数为260, 小于 6.5536e+06的样本数为780, 总样本为780.
Summary(汇总)
例如,指标prometheus_tsdb_wal_fsync_duration_seconds的指标类型为Summary。 它记录了Prometheus Server中wal_fsync处理的处理时间,通过访问Prometheus Server的/metrics地址,可以获取到以下监控样本数据:
1
2
3
4
5
6
7
# HELP prometheus_tsdb_wal_fsync_duration_seconds Duration of WAL fsync. # TYPE prometheus_tsdb_wal_fsync_duration_seconds summary prometheus_tsdb_wal_fsync_duration_seconds{quantile="0.5"} 0.012352463 prometheus_tsdb_wal_fsync_duration_seconds{quantile="0.9"} 0.014458005 prometheus_tsdb_wal_fsync_duration_seconds{quantile="0.99"} 0.017316173 prometheus_tsdb_wal_fsync_duration_seconds_sum 2.888716127000002 prometheus_tsdb_wal_fsync_duration_seconds_count 216
从上面的样本中可以得知当前Prometheus Server进行wal_fsync操作的总次数为216次,耗时2.888716127000002s。其中中位数(quantile=0.5)的耗时为0.012352463,9分位数(quantile=0.9)的耗时为0.014458005s。
rate[1m]:表示 1 分钟的增长速率,只能用于 counter 类型的数据。
sum:表示 value 求和。
by type:表示将求和后的数据按 metric 原始值中的 type 进行分组。
Legend format:表示指标名称的格式。
Resolution:默认打点步长是 15s,Resolution 表示是否将多个样本数据合并成一个点。
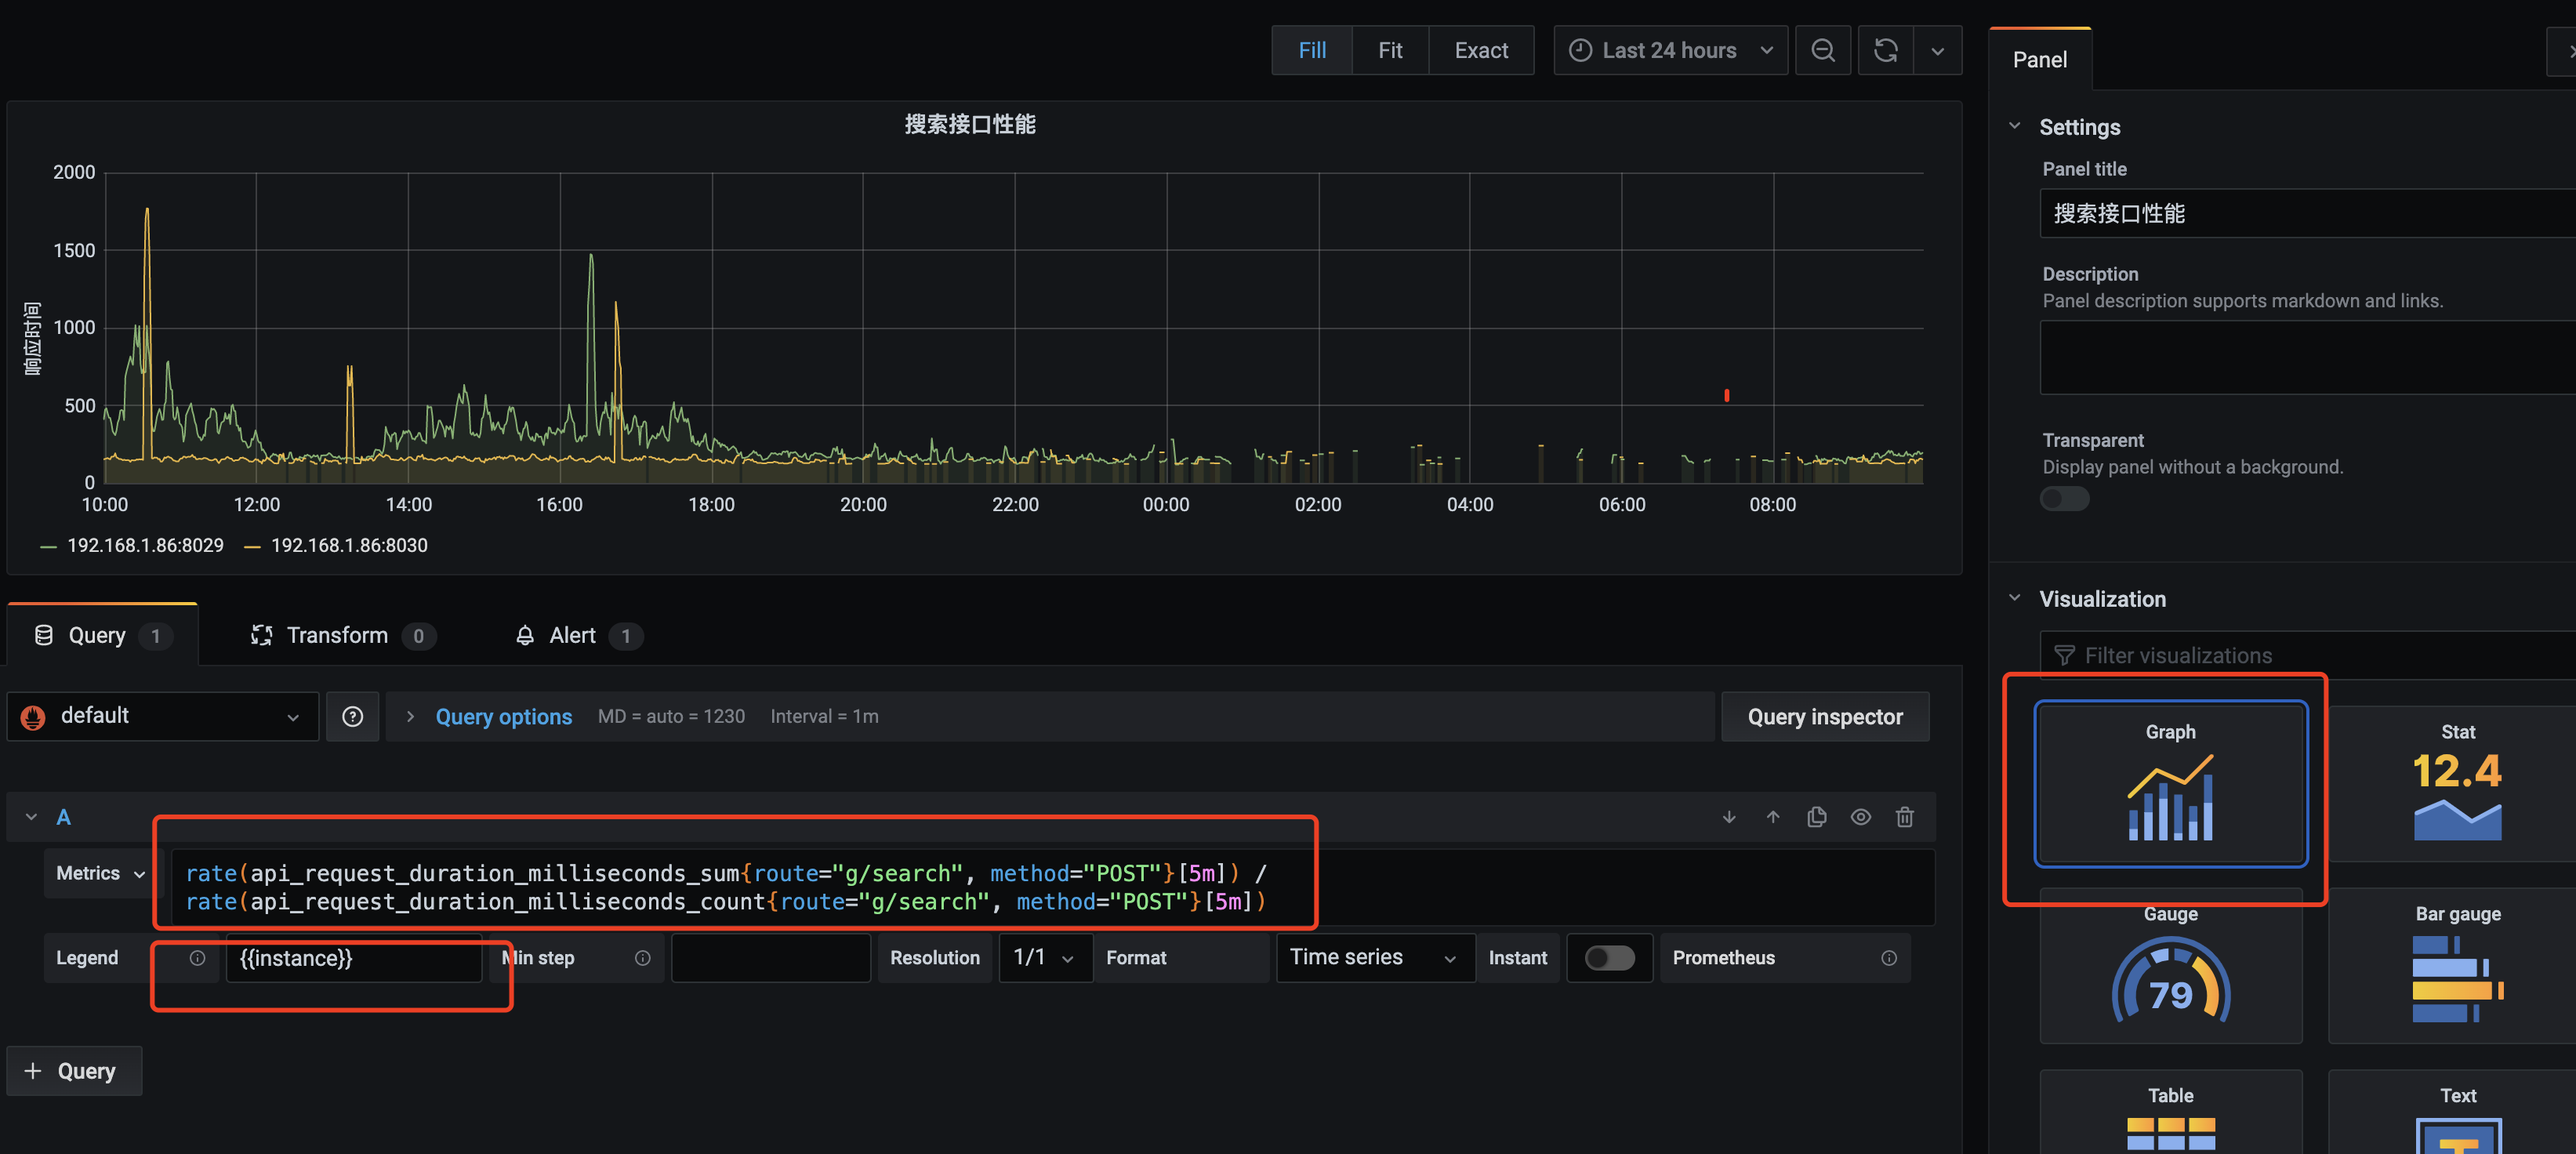
5分钟内请求总时间除以总次数得到api响应时间均值
1 rate(api_request_duration_milliseconds_sum{route="g/search", method="POST"}[5m]) / rate(api_request_duration_milliseconds_count{route="g/search", method="POST"}[5m])
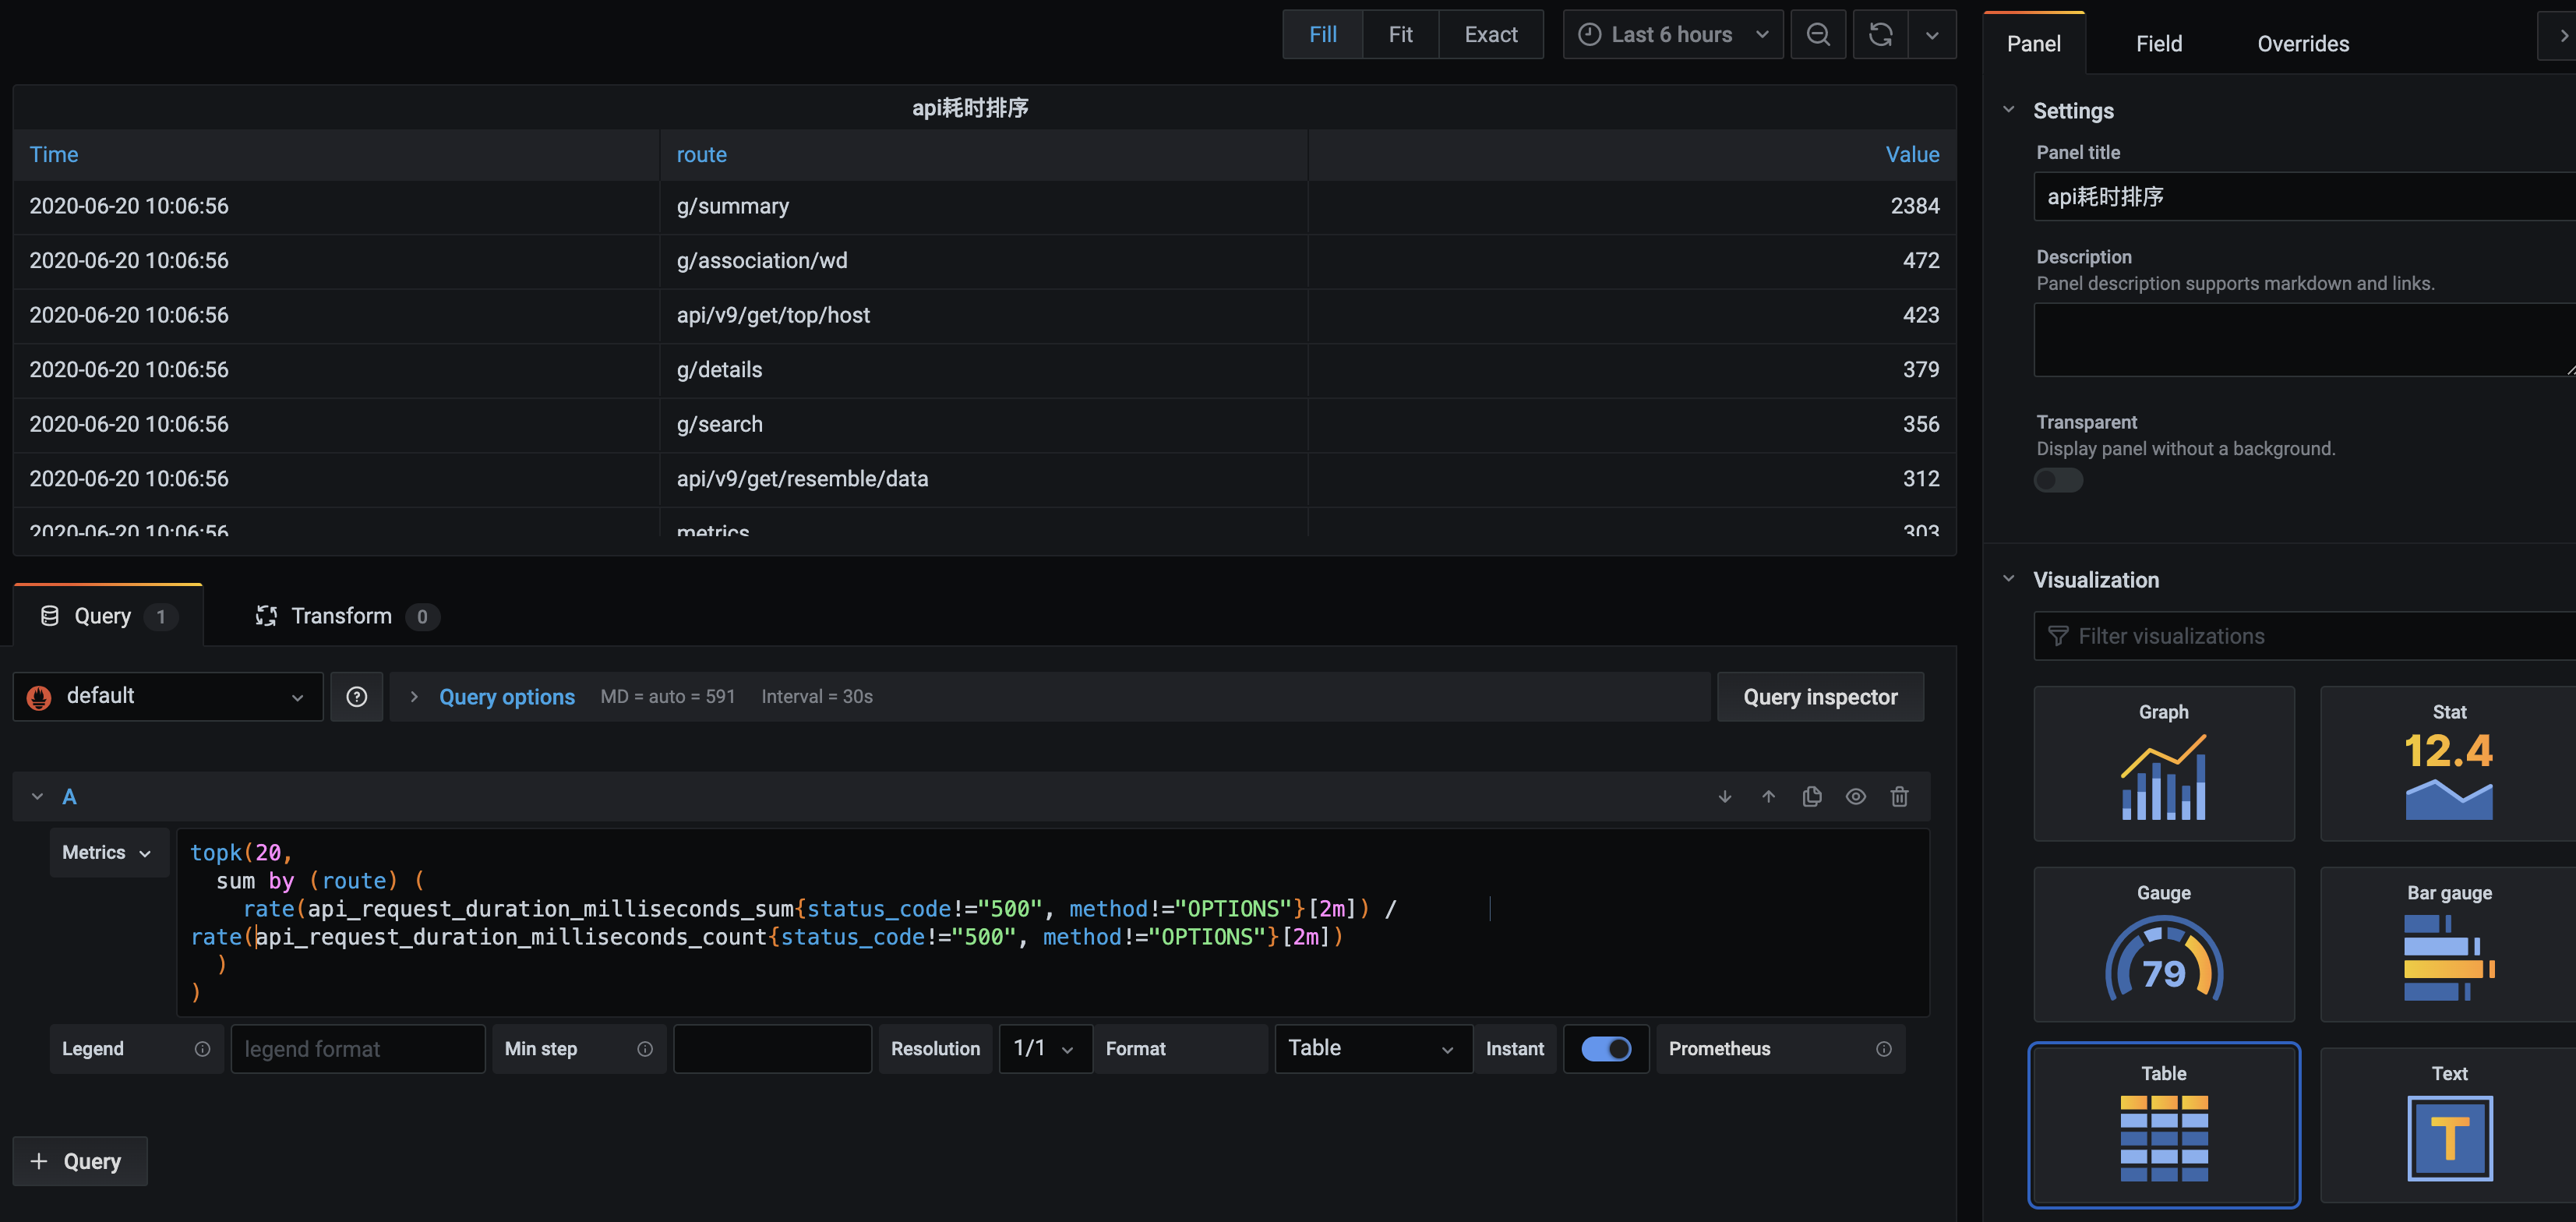
1
2
3
4
5
6
7
topk(20, sum by (route) ( rate(api_request_duration_milliseconds_sum{status_code!="500", method!="OPTIONS"}[2m]) / rate(api_request_duration_milliseconds_count{status_code!="500", method!="OPTIONS"}[2m]) ) )
sum byroute 的响应时间 取Top20,得到响应时间慢的API
1 topk(10, sum by (route) (rate(api_request_duration_milliseconds_count{status_code!="500"}[5m])))
稍微调整下可以拿到当前时间请求频繁的接口
基于方法和错误码统计Center的整体 rpc 请求错误频率:
1 sum by (method, code) (rate(rpc_invoke_cnt_c{job="Center",code!="0"}[1m]))
QPS 的话,可以使用自带的函数 rate,rate(http_requests_total[10s]) 表示以 10s 作为时间单元来统计 QPS。
具体请参考: https://yunlzheng.gitbook.io/prometheus-book/parti-prometheus-ji-chu/promql/prometheus-promql-functions
1 2 3 4 5 6 7 8 9 10 11 12 13 14 15 16 17 18 19 20 21 22 23 24 25 26 27 28 29 30 31 32 <dependencies > <dependency > <groupId > org.springframework.boot</groupId > <artifactId > spring-boot-starter</artifactId > <version > ${springboot.version}</version > </dependency > <dependency > <groupId > org.springframework.boot</groupId > <artifactId > spring-boot-configuration-processor</artifactId > <version > ${springboot.version}</version > </dependency > <dependency > <groupId > org.springframework.boot</groupId > <artifactId > spring-boot-starter-aop</artifactId > <version > ${springboot.version}</version > </dependency > <dependency > <groupId > org.springframework.boot</groupId > <artifactId > spring-boot-starter-actuator</artifactId > <version > ${springboot.version}</version > </dependency > <dependency > <groupId > io.micrometer</groupId > <artifactId > micrometer-registry-prometheus</artifactId > <version > 1.6.4</version > </dependency > <dependency > <groupId > org.springframework.boot</groupId > <artifactId > spring-boot-starter-web</artifactId > <version > ${springboot.version}</version > </dependency > </dependencies >
1
2
3
4
5
6
@Retention(RetentionPolicy.RUNTIME) @Target({ElementType.TYPE}) @Documented @Import({PrometheusMetricsRegistrar.class}) public @interface EnablePrometheus {}
1
2
3
4
5
6
7
8
public class PrometheusMetricsRegistrar implements ImportBeanDefinitionRegistrar @Override public void registerBeanDefinitions (AnnotationMetadata importingClassMetadata, BeanDefinitionRegistry registry) BeanDefinition beanDefinition = BeanDefinitionBuilder.genericBeanDefinition(PrometheusMetricsAspect.class).getBeanDefinition(); registry.registerBeanDefinition("prometheusMetricsAspect" , beanDefinition); } }
1
2
3
4
5
6
7
8
9
10
11
12
13
14
15
16
17
18
19
20
21
22
23
24
25
26
27
28
29
30
31
32
33
34
35
36
37
38
39
40
41
42
43
44
45
46
47
48
49
50
51
52
53
54
55
56
57
58
59
60
61
62
63
64
65
66
67
@Component @Aspect public class PrometheusMetricsAspect private final Log logger = LogFactory.getLog(getClass()); @Autowired private CollectorRegistry collectorRegistry; private Counter requestTotal; private Counter requestError; private Histogram apiTimeConsuming; @PostConstruct private void init () requestTotal = Counter.build().name("easyliao_http_requests_total" ).labelNames("uri" , "method" , "status" ) .help("http请求总数" ).register(collectorRegistry); requestError = Counter.build().name("easyliao_http_requests_error" ).labelNames("uri" , "method" , "status" ) .help("http请求错误数" ).register(collectorRegistry); apiTimeConsuming = Histogram.build().name("easyliao_api_time_consuming" ).labelNames("uri" , "method" , "status" ) .help("接口耗时" ).buckets(0.01 , 0.02 , 0.05 , 0.1 , 0.2 , 0.5 ).register(collectorRegistry); } @Pointcut("@annotation(com.easyliao.monitor.annotation.PrometheusMetrics)") public void api () @Around(value = "api()") public Object metricsCollector (ProceedingJoinPoint point) throws Throwable MethodSignature methodSignature = (MethodSignature) point.getSignature(); PrometheusMetrics prometheusMetrics = methodSignature.getMethod().getAnnotation(PrometheusMetrics.class); if (prometheusMetrics != null ) { String uri; HttpServletRequest request = ((ServletRequestAttributes) RequestContextHolder.getRequestAttributes()) .getRequest(); HttpServletResponse response = ((ServletRequestAttributes) RequestContextHolder.getRequestAttributes()) .getResponse(); if (StringUtils.isNotEmpty(prometheusMetrics.name())) { uri = prometheusMetrics.name(); } else { uri = request.getRequestURI(); } String method = request.getMethod(); int status = response.getStatus(); requestTotal.labels(uri, method, String.valueOf(status)).inc(); Histogram.Timer requestTimer = apiTimeConsuming.labels(uri, method, String.valueOf(status)).startTimer(); Object object; try { object = point.proceed(); } catch (Exception e) { requestError.labels(uri, method, String.valueOf(status)).inc(); throw e; } finally { requestTimer.observeDuration(); } return object; } else { return point.proceed(); } } }
1
2
3
4
5
6
7
8
9
10
11
12
@Target(ElementType.METHOD) @Retention(RetentionPolicy.RUNTIME) @Documented public @interface PrometheusMetrics { String name () default "" ; }
1 2 3 4 5 6 7 8 9 10 11 12 13 14 15 16 17 18 19 20 21 22 23 24 @Component public class CounterMetrics @Autowired private CollectorRegistry collectorRegistry; @Bean public Counter httpRequestsTotalCounterCollector () return Counter.build().name("http_requests_total" ).labelNames("path" , "method" , "code" ).help("http请求总计数" ) .register(collectorRegistry); } }
1 2 3 4 5 6 7 8 9 10 11 12 13 14 15 16 17 18 19 20 21 @Component public class GuageMetrics @Autowired private CollectorRegistry collectorRegistry; @Bean public Gauge httpInprogressRequestsGuageCollector () return Gauge.build() .name("http_inprogress_requests" ).labelNames("path" , "method" , "code" ) .help("http当前正在处理的请求数" ).register(collectorRegistry); } }
1 2 3 4 5 6 7 8 9 10 11 12 13 14 15 16 17 18 19 20 21 22 23 @Component public class HistogramMetrics @Autowired private CollectorRegistry collectorRegistry; @Bean public Histogram httpRequestsBytesHistogramCollector () return Histogram.build().labelNames("path" , "method" , "code" ) .name("http_requests_bytes_histogram" ).help("http bucket 请求大小区间分布图" ) .register(collectorRegistry); } }
1
2
3
4
5
6
7
8
9
10
11
12
13
14
15
16
17
18
19
20
@Component public class SummaryMetrics @Autowired private CollectorRegistry collectorRegistry; @Bean public Summary httpRequestsBytesSummaryCollector () return Summary.build() .name("http_requests_bytes_summary" ) .labelNames("path" , "method" , "code" ) .help("Request bytes " ).register(collectorRegistry); } }
1
2
3
4
5
6
7
8
9
10
11
12
13
14
15
16
17
18
19
20
21
22
23
24
25
26
27
28
29
30
31
32
33
34
35
36
37
38
39
40
41
42
43
44
45
46
47
48
49
50
51
52
53
54
55
56
57
58
59
60
61
62
63
64
@Slf4j public class PrometheusInterceptor implements HandlerInterceptor @Autowired @Qualifier("httpRequestsTotalCounterCollector") private Counter httpRequestsTotalCounterCollector; @Autowired @Qualifier("httpInprogressRequestsGuageCollector") private Gauge httpInprogressRequestsGuageCollector; @Autowired @Qualifier("httpRequestsBytesHistogramCollector") private Histogram httpRequestsBytesHistogramCollector; @Autowired @Qualifier("httpRequestsBytesSummaryCollector") private Summary httpRequestsBytesSummaryCollector; @Override public boolean preHandle (HttpServletRequest request, HttpServletResponse response, Object handler) throws Exception { log.info("Prometheus intercrptor preHandle ..." ); String requestURI = request.getRequestURI(); String method = request.getMethod(); int status = response.getStatus(); httpRequestsTotalCounterCollector.labels(requestURI, method, String.valueOf(status)).inc(); httpInprogressRequestsGuageCollector.labels(requestURI, method, String.valueOf(status)).inc(); httpRequestsBytesHistogramCollector.labels(requestURI, method, String.valueOf(status)).observe(request.getContentLength()); httpRequestsBytesSummaryCollector.labels(requestURI, method, String.valueOf(status)).observe(new Random().nextInt(100 )); return HandlerInterceptor.super .preHandle(request, response, handler); } @Override public void postHandle (HttpServletRequest request, HttpServletResponse response, Object handler, ModelAndView modelAndView) throws Exception HandlerInterceptor.super .postHandle(request, response, handler, modelAndView); } @Override public void afterCompletion (HttpServletRequest request, HttpServletResponse response, Object handler, Exception ex) throws Exception { String requestURI = request.getRequestURI(); String method = request.getMethod(); int status = response.getStatus(); httpInprogressRequestsGuageCollector.labels(requestURI, method, String.valueOf(status)).dec(); HandlerInterceptor.super .afterCompletion(request, response, handler, ex); } }
1
2
3
4
5
6
7
8
9
10
11
12
13
14
@Configuration public class InterceptorConfiguration implements WebMvcConfigurer @Bean public HandlerInterceptor prometheusInterceptor () return new PrometheusInterceptor(); } @Override public void addInterceptors (InterceptorRegistry registry) registry.addInterceptor(prometheusInterceptor()).addPathPatterns("/**" ); } }
本文到此结束,感谢阅读。如果您觉得不错,请关注公众号【当我遇上你】,您的支持是我写作的最大动力。